Crypto technical analysis is the practice of using price, trading volume and other market data to assess trends, momentum, volatility and potential trading setups.
Modern crypto TA can extend beyond price action and conventional technical indicators. A trader might analyze market structure and momentum, for example, while also checking whether derivatives positioning supports or challenges the same trading idea.
This guide focuses on how technical analysis can be applied as a structured trading process, from identifying market conditions and important price levels to combining indicators, confirming setups and managing risk. It does not treat TA as a guaranteed forecasting system. Every signal can fail, and even a strong setup needs a clear invalidation point and risk plan.
Editor's Note (Aug. 25, 2026): We fully updated this article in August 2026 to reflect how crypto technical analysis is used today. The new version expands beyond traditional indicators and chart patterns to cover market structure, volume, derivatives data, trade construction, risk management, backtesting, common failure points and modern TA tools. We also added a practical step-by-step framework to help readers apply technical analysis as a structured, risk-aware process rather than a price-prediction system.
Crypto Technical Analysis: Quick Verdict
Crypto technical analysis can be useful, but it works best as a decision and risk-management framework rather than a system for predicting prices with certainty. A technical setup deals in probability. Price structure should generally come before any technical indicator, and confirmation, invalidation, position sizing and risk management should be defined before capital is put at risk.
A Useful TA Process Should Answer Five Questions
-
What market environment am I trading? Identify whether the market is trending, ranging, volatile or compressed before choosing a setup or indicator.
-
Where are the important levels? Mark market structure, support, resistance and other price zones that could influence the trade.
-
What would confirm the setup? Look for relevant confirmation from price action, volume, momentum, volatility or crypto-specific positioning data rather than relying on one indicator.
-
What would invalidate it? Define the price behavior that would show the original trade thesis is wrong and use it to establish a logical stop-loss area.
-
Is the potential reward worth the risk? Compare the expected upside with the possible loss, then size the position so a failed setup stays within the trader's risk limits.
Key Principles
- Price structure should generally come before indicator signals.
- One technical indicator should not determine whether a trade is taken.
- Technical analysis becomes less reliable when liquidity is poor, spreads are wide or price is easily manipulated.
- No technical setup removes the need for a clear invalidation point, stop-loss planning, position sizing and risk management.
- A strong-looking setup can still fail, so the risk-reward ratio should be assessed before entry.
Disclaimer
This guide is for educational purposes only and is not financial advice.
Disclosure
Some links in this guide may be affiliate links. If you choose to use a service through these links, we may earn a commission at no additional cost to you.

What Is Crypto Technical Analysis?
Crypto technical analysis uses historical and current market data to evaluate how price is behaving. Traders use it to identify market trends, support and resistance, momentum, volatility, market structure and possible trade locations.
Most technical indicators are mathematical transformations of price or trading volume. They can help organize market information, but they are not independent predictive signals and do not reveal the intrinsic value of a cryptocurrency.
TA can be applied across different timeframes and trading styles, from short-term trading to longer-term position management. Crypto charts usually display price through candlesticks.
If concepts such as candlesticks, OHLC data or basic chart navigation are unfamiliar, start with our guide on how to read crypto charts.
The Core Assumptions Behind Technical Analysis
Technical analysis generally rests on a few ideas:
- Markets reflect the collective behavior of buyers and sellers.
- Trends can persist for a period of time.
- Traders may react repeatedly around important price levels.
- Historical price behavior can provide useful context.
These are working assumptions, not guarantees. Similar market conditions can produce very different outcomes.
Readers who are new to entries, trading pairs, order types and the broader trading process can also start with our guide to crypto trading for beginners.
Technical Analysis vs. Fundamental Analysis
Technical analysis focuses on market behavior, while fundamental analysis focuses on the underlying asset and its potential value.
| Technical Analysis | Fundamental Analysis |
|---|---|
| Studies price action, volume and market trends | Studies the asset, protocol and broader fundamentals |
| Focuses on market structure, momentum and volatility | Focuses on tokenomics, adoption, network activity and valuation |
| Often used to identify entries, exits and risk levels | Often used to assess whether an asset is worth owning |
| Can be applied across short and long timeframes | Usually supports a broader investment thesis |
The two approaches do not need to compete. Fundamentals can influence what an investor wants to own, while technical analysis can help determine when, where and under what risk conditions they enter or exit.
Start With Market Structure and Market Regime
Before adding indicators, start with the most basic question: what is price actually doing?
Market structure helps traders determine whether an asset is trending higher, trending lower or moving sideways. Market regime adds another layer by considering whether conditions are trending, ranging, volatile or relatively quiet.
Traders who specifically want to build strategies around persistent directional moves can explore our guide to trend trading.
Bullish, Bearish and Sideways Market Structure
A market's structure is usually read through the sequence of highs and lows it creates.
| Structure | Typical interpretation |
|---|---|
| Higher highs + higher lows | Bullish |
| Lower highs + lower lows | Bearish |
| Repeated reactions between boundaries | Range |
A higher high occurs when price moves above a previous swing high, while a higher low forms above the previous major low. Repeated higher highs and higher lows usually indicate an uptrend.
The opposite structure, lower highs and lower lows, generally points to a downtrend.
When price repeatedly moves between relatively defined support and resistance areas without establishing either sequence, the market is ranging.
A structural break occurs when price disrupts the existing sequence. For example, an uptrend that stops producing higher lows and breaks beneath an important swing low may be showing early signs of weakening or reversal. One break alone, however, does not guarantee that the broader trend has changed.
Trending vs. Ranging Markets
Identifying the market regime before choosing indicators is important because technical tools behave differently under different conditions.
In a strong trend, momentum indicators such as RSI can remain elevated or depressed for extended periods. Treating every "overbought" reading as a sell signal can therefore work badly during a powerful uptrend.
Moving-average crossover systems face the opposite problem in sideways markets. When price repeatedly crosses above and below the same averages, they can generate a series of false signals.
Volatility also changes how setups behave. High-volatility markets tend to produce larger price swings and wider invalidation levels, while low-volatility periods can produce tighter ranges before an eventual expansion.
The goal is not simply to label the market. It is to choose analysis techniques that fit the environment.
Trendlines and Price Channels
Trendlines provide a simple way to visualize directional market structure. An ascending trendline connects a series of rising lows, while a descending trendline connects falling highs.
When price repeatedly moves between two roughly parallel boundaries, traders may describe the structure as an ascending or descending price channel.
Trendlines should support what the price structure is already showing. They should not be adjusted repeatedly until they fit a preferred interpretation.
A break of a trendline can signal weakening momentum, but it does not automatically mean the trend has reversed. A stronger structural change usually involves price also breaking an important swing high, swing low or established support or resistance area.
Support and Resistance in Crypto
Support and resistance are price areas where buying or selling pressure has previously been strong enough to slow, stop or reverse a move. They are among the most widely used concepts in crypto technical analysis because they can help traders identify potential entries, exits, breakout levels and invalidation points.
How Traders Identify Support and Resistance
Support is an area where demand has previously helped prevent price from falling further, while resistance is an area where selling pressure has previously limited upside.
Traders commonly identify these areas by looking for:
- Previous swing highs and swing lows
- Repeated price reactions around the same area
- Consolidation zones
- Major breakout and retest levels
- Psychologically significant prices, such as round numbers
- Higher-timeframe levels that have influenced price over longer periods
A simple three-step process is:
- Find areas where price has reacted before.
- Prioritize repeatedly tested or higher-timeframe levels.
- Treat them as zones rather than exact prices.
Why Support and Resistance Are Better Treated as Zones
Support and resistance are generally better treated as areas of interest rather than exact prices.
Markets rarely reverse at precisely the same level every time. Wicks can briefly move beyond an established zone, different exchanges can print slightly different highs and lows, and liquidity clustered around obvious levels can cause temporary price excursions.
For example, if Bitcoin has repeatedly found support around $100,000, that does not mean every reaction must occur at exactly $100,000. Traders may instead identify a broader support zone around that area and watch how price behaves when it returns.
Support and Resistance Role Reversal
Support and resistance can also switch roles.
When price breaks convincingly above resistance, that former resistance may later act as support. Likewise, a support level that breaks can become resistance if price subsequently retests it from below.
These retests can help traders assess whether a breakout is holding. A successful retest may strengthen the case for continuation, while a failed retest can suggest the breakout is weakening.
This idea also becomes useful when defining trade invalidation. If a setup depends on former resistance holding as new support, a decisive move back below that area may indicate that the original trade thesis is no longer valid.
The Most Useful Technical Indicators for Crypto
Technical indicators are most useful when each one answers a specific question. Adding several indicators that measure the same thing can create the illusion of confirmation without adding much new information.
For example, three momentum indicators flashing bullish signals are not necessarily three independent reasons to enter a trade.
| Trading question | Useful tools |
|---|---|
| What direction is the market moving? | Market structure, moving averages |
| Is momentum strengthening or weakening? | RSI, MACD |
| Is volatility expanding? | ATR, Bollinger Bands |
| Where has trading activity concentrated? | Volume Profile |
| Where is volume-weighted average price? | VWAP |
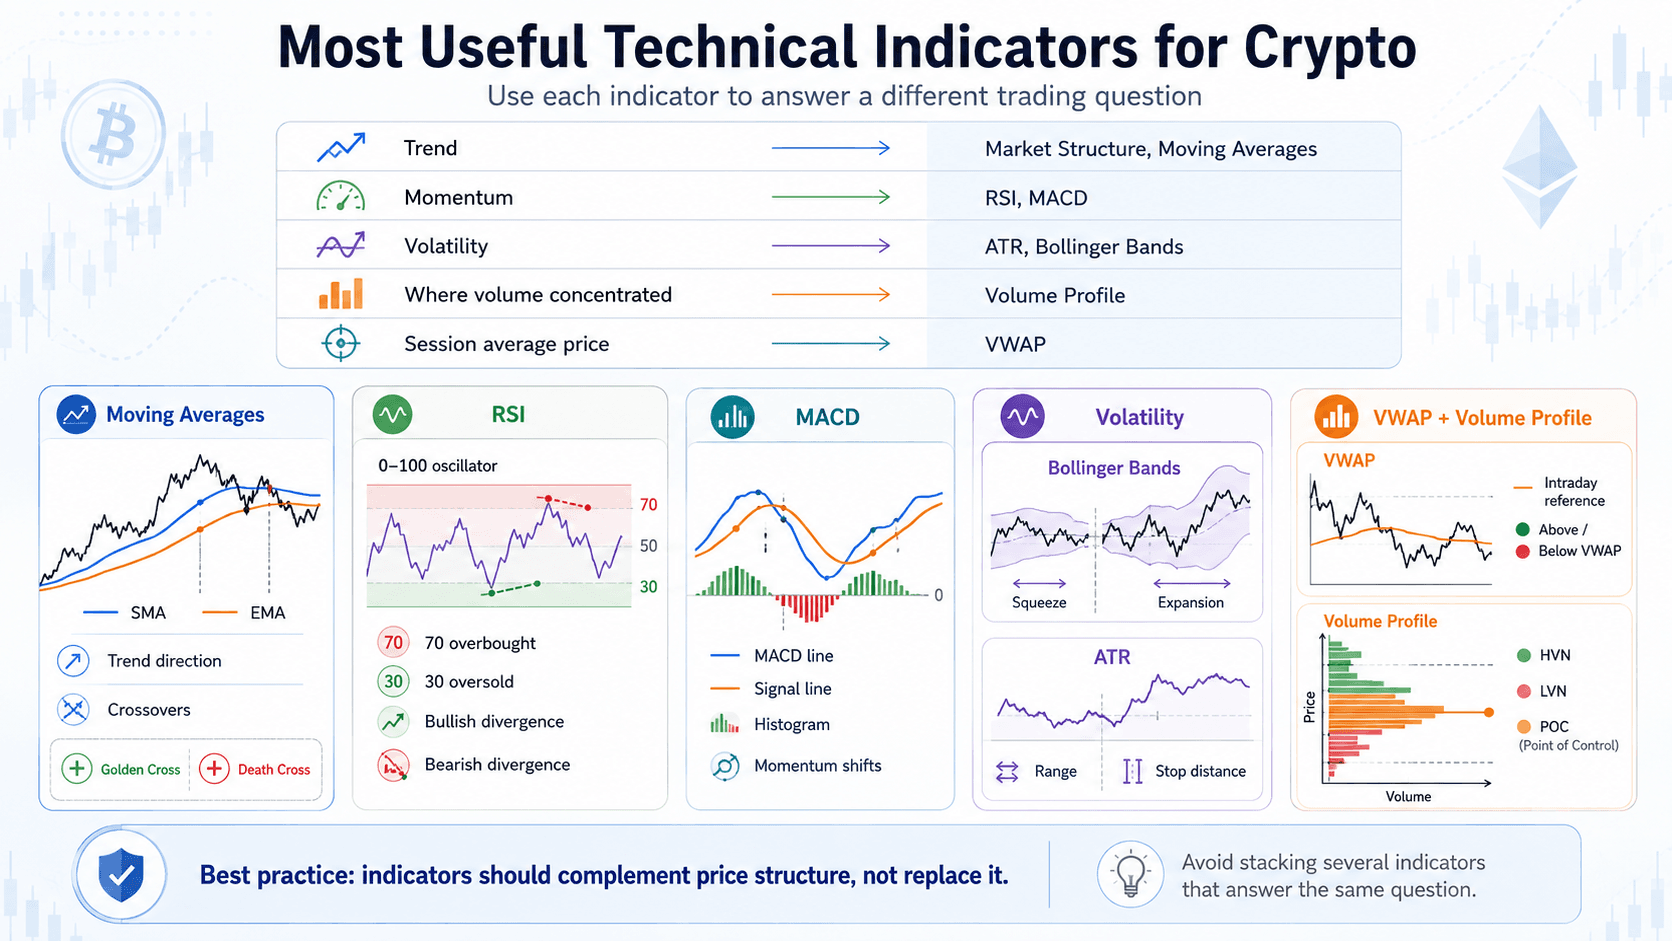 Technical Indicators Help Traders Assess Trend, Momentum, Volatility And Trading Activity
Moving Averages: SMA and EMA
A moving average smooths price data to make the underlying trend easier to see.
The simple moving average (SMA) gives equal weight to every price in the selected period, while the exponential moving average (EMA) gives more weight to recent prices and therefore reacts more quickly.
Common settings include the 20, 50, 100 and 200-period moving averages. Traders may use them to assess trend direction, identify dynamic reference levels or watch for crossovers.
Two widely followed examples are:
- Golden Cross: A shorter-term moving average crosses above a longer-term average.
- Death Cross: A shorter-term moving average crosses below a longer-term average.
Moving averages are lagging indicators because they are calculated from previous price data. Common settings such as the 50 or 200 are market conventions, not universally optimal parameters.
Relative Strength Index (RSI)
The Relative Strength Index (RSI) is a momentum oscillator that moves between 0 and 100.
Traditional interpretation often treats readings above 70 as overbought and readings below 30 as oversold. These thresholds should not be treated as automatic sell or buy signals.
During a strong uptrend, RSI can remain overbought for an extended period. The same applies to oversold readings during strong downtrends.
Traders also watch for divergence:
- Bullish divergence: Price makes a lower low while RSI makes a higher low.
- Bearish divergence: Price makes a higher high while RSI makes a lower high.
Divergence can indicate weakening momentum, but it still requires context and confirmation.
MACD
The Moving Average Convergence Divergence (MACD) tracks changes in trend and momentum using relationships between moving averages.
It consists of three main components:
- MACD line
- Signal line
- Histogram
A crossover between the MACD and signal lines can indicate a shift in momentum, while the histogram shows the changing distance between them. Traders may also watch for divergence between MACD and price.
Compared with RSI, MACD places more emphasis on changes in trend and moving-average momentum, while RSI focuses more directly on the strength of recent price moves.
Like moving averages, MACD is based on past price data and can lag fast market reversals.
Bollinger Bands and ATR
Bollinger Bands and Average True Range (ATR) both help traders evaluate volatility, but they do so differently.
Bollinger Bands place upper and lower bands around a moving average using standard deviation. When the bands narrow, volatility is contracting. When they widen, volatility is expanding.
A prolonged period of narrow bands is often called a Bollinger Band squeeze. It can indicate compressed volatility, although it does not tell traders which direction price will eventually move.
ATR measures the average trading range over a selected period. Traders can use it to compare current volatility with previous conditions or to help determine whether a stop-loss is unrealistically tight relative to normal price movement.
Neither a Bollinger Band touch nor a high ATR reading should be treated as a standalone buy or sell signal.
VWAP and Volume Profile
Volume Weighted Average Price (VWAP) shows the average price at which an asset has traded, weighted by volume. It is commonly used as an intraday reference point.
Price trading above VWAP may indicate that current market prices are above the session's volume-weighted average, while price below VWAP indicates the opposite. Traders may use it to assess trend context, execution quality or potential areas of interest.
Volume Profile looks at volume from a different angle. Instead of showing when trading activity occurred, it shows how much volume occurred at different price levels.
Important concepts include:
- High-volume nodes: Areas where substantial trading activity has occurred.
- Low-volume nodes: Areas where relatively little trading took place.
- Point of Control (POC): The price level with the highest recorded volume in the selected profile.
Ordinary volume helps answer when market participation increased or decreased. Volume Profile helps show where that participation was concentrated by price.
The broader lesson is that indicators should complement price structure rather than replace it. A moving average, RSI reading or VWAP level becomes more useful when it answers a specific question within an already defined technical setup.
How Volume Confirms or Challenges a Technical Setup
Volume helps traders judge how much market participation sits behind a price move. A breakout, trend or reversal accompanied by stronger trading volume may carry more weight than the same move occurring on weak participation.
Volume is best used as context, not as proof that a move will continue.
Volume During Trends and Breakouts
When price expands in the direction of an existing trend and trading volume also increases, it can suggest stronger participation behind the move.
The opposite can also be useful. If price keeps rising while volume steadily weakens, the move may be losing participation even if the trend has not yet reversed.
Breakouts are another common use case. A move through support or resistance accompanied by a clear increase in volume can strengthen the breakout case. Low-volume breakouts may deserve more caution because fewer participants appear to be supporting the move.
Large volume spikes can signal intense buying or selling pressure, but they require context. A spike can accompany a genuine breakout, a liquidation event, panic selling or even the final stage of an exhausted move.
| Price and volume scenario | Possible interpretation |
|---|---|
| Price rising + volume rising | Stronger buying participation |
| Price rising + volume falling | Upward move may be losing participation |
| Price falling + selling volume rising | Increasing selling pressure |
| Breakout + volume expansion | Stronger breakout confirmation |
| Breakout + weak volume | Greater risk of poor follow-through |
Price and Volume Divergence
Price-volume divergence occurs when price and trading activity begin telling different stories.
For example, a cryptocurrency may continue making higher highs while volume weakens. That does not automatically signal a reversal, but it can suggest that fewer participants are driving the advance.
Likewise, falling prices accompanied by increasing selling volume can indicate stronger bearish participation.
Volume can also decline while price consolidates inside a narrow range. This often reflects reduced activity before the market makes a larger move, although declining volume alone cannot predict the direction of that expansion.
The key is to interpret volume alongside market structure, liquidity, support and resistance, rather than treating any single volume pattern as a standalone trading signal.
Crypto Chart Patterns
Chart patterns are recurring price formations traders use to organize market behavior. Broadly, they fall into two groups: continuation patterns, which suggest the existing trend may resume, and reversal patterns, which suggest the trend may be weakening or changing direction.
The shape itself is never enough. Market structure, volume, location and confirmation all affect how useful a pattern is.
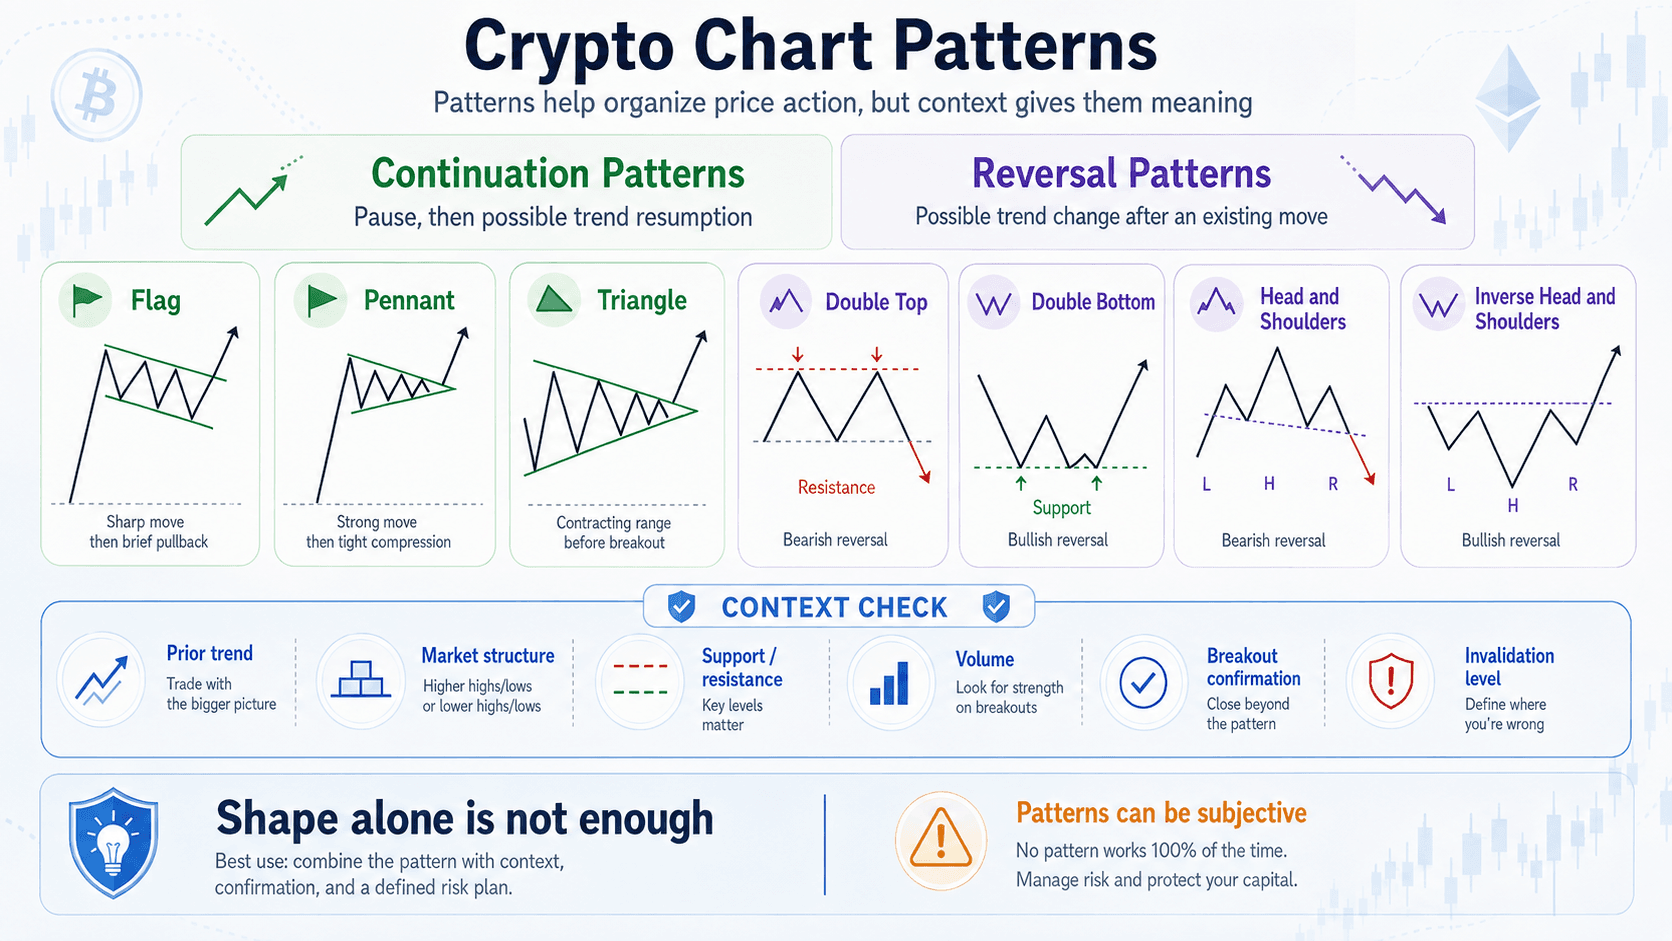 Crypto Chart Patterns Help Traders Identify Possible Trend Continuation Or Reversal Setups
Continuation Patterns
Continuation patterns form when price pauses or consolidates before potentially resuming the prevailing trend.
Common examples include:
- Flags: Short consolidations that develop after a sharp directional move.
- Pennants: Tighter consolidations where price compresses after a strong move.
- Triangles: Periods of contracting price action that can eventually break in either direction.
These formations are called continuation patterns because they are often interpreted within the context of an existing trend. They do not guarantee continuation, and a failed breakout can invalidate the setup.
Reversal Patterns
Reversal patterns suggest that an established trend may be losing strength and could change direction.
Common examples include:
- Double top: Two attempts to move above a similar resistance area, often associated with weakening upside momentum.
- Double bottom: Two tests of a similar support area, potentially indicating weakening selling pressure.
- Head and shoulders: A three-peak formation commonly associated with a possible bearish reversal.
- Inverse head and shoulders: The opposite structure, commonly associated with a possible bullish reversal.
These patterns generally become more meaningful once price confirms the formation by breaking an important support or resistance level.
Why Context Is More Important Than the Shape
A chart pattern should not be traded simply because price resembles a familiar formation.
A stronger analysis considers:
- The trend that existed before the pattern formed
- Broader market structure
- Nearby support and resistance
- Trading volume
- Whether the breakout is confirmed
- Where the setup becomes invalid
Pattern recognition is also partly subjective. Two traders can look at the same chart and draw slightly different formations, particularly when the pattern is incomplete.
For that reason, chart patterns are best treated as frameworks for organizing price action, not standalone predictions. Their usefulness increases when the pattern fits the broader market context and gives the trader a clear breakout, invalidation level and risk plan.
Crypto-Specific Technical Analysis Metrics
Traditional technical analysis mostly focuses on price, volume and indicators derived from them. Crypto traders can also observe derivatives positioning and liquidation activity in near real time, adding another layer of context to a technical setup.
These metrics should not be treated as standalone buy or sell signals. Their value comes from interpreting them alongside price action, market structure and volume.
| Metric | What it helps assess |
|---|---|
| Open interest | Changes in derivatives participation |
| Funding rate | Positioning pressure in perpetual markets |
| Liquidations | Forced leverage unwinds |
| CVD | Aggressive buying versus selling |
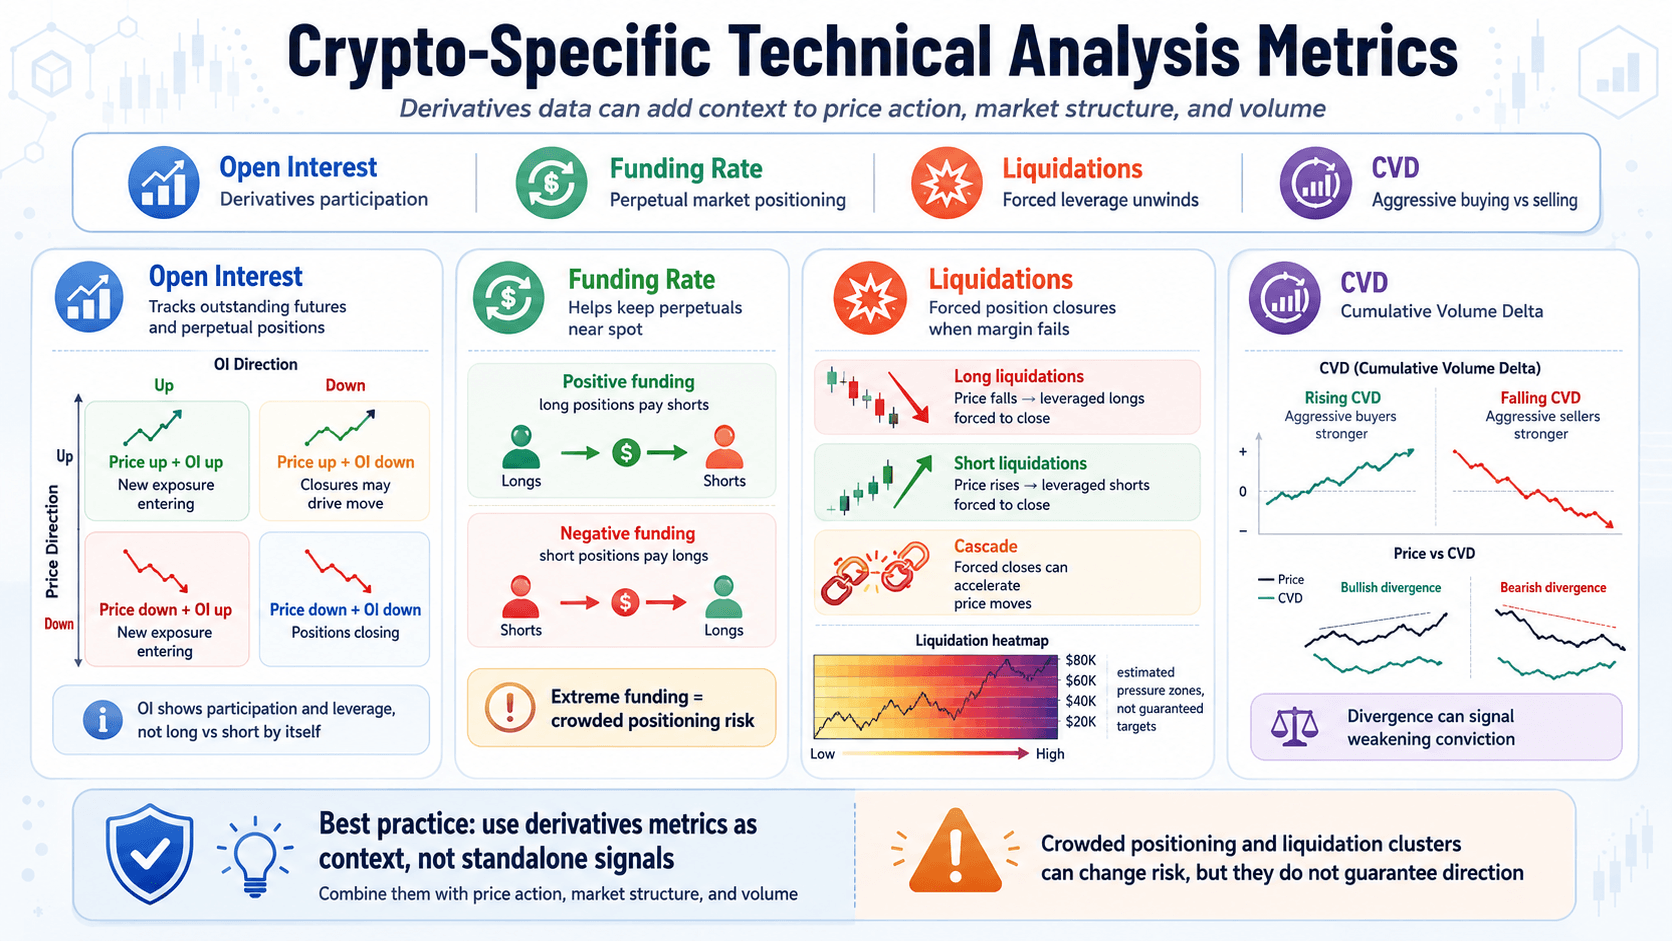 Crypto-Specific Metrics Add Derivatives Positioning And Liquidation Context To Technical Analysis
Open Interest
Open interest (OI) measures the total number or value of outstanding futures and perpetual futures positions that have not yet been closed.
Rising open interest generally means more derivatives exposure is entering the market, while falling open interest suggests positions are being closed. Neither is inherently bullish or bearish.
OI becomes more useful when interpreted alongside price:
| Price and OI | Possible interpretation |
|---|---|
| Price rising + OI rising | New positions are entering as price advances |
| Price rising + OI falling | Position closures may be contributing to the rise |
| Price falling + OI rising | New positions are entering as price declines |
| Price falling + OI falling | Positions are being closed as price declines |
Open interest does not reveal whether every new position is long or short because derivatives trades generally involve counterparties on both sides. It is better viewed as a measure of changing market participation and leverage.
Readers unfamiliar with futures and perpetual contracts can see our guide to crypto futures for a deeper explanation of how these instruments work.
Funding Rates
Perpetual futures do not have an expiry date, so exchanges use funding rates to help keep perpetual contract prices close to the underlying spot market.
Funding payments generally pass between long and short positions at regular intervals.
- Positive funding: Long positions typically pay short positions.
- Negative funding: Short positions typically pay long positions.
- Extreme funding: Can indicate increasingly one-sided or crowded positioning.
For example, rapidly rising prices combined with unusually positive funding may suggest that leveraged long exposure is becoming crowded. That does not mean price must reverse, but it can change the risk profile of the setup.
Funding is therefore best used as positioning context rather than a standalone contrarian signal.
Liquidation Data
A liquidation occurs when a leveraged position can no longer meet its margin requirements and is forcibly closed by the trading platform.
This can create:
- Long liquidations: Leveraged long positions are forcibly closed as price falls.
- Short liquidations: Leveraged short positions are forcibly closed as price rises.
- Liquidation cascades: One wave of forced closures accelerates price movement and triggers additional liquidations.
Traders may also use liquidation heatmaps to estimate price areas where clusters of leveraged positions could face liquidation.
These heatmaps should be interpreted carefully. They estimate concentrations based on available market data and modeling. They do not show guaranteed price targets or prove that price will move toward a particular liquidation cluster.
Our guide to crypto margin trading explains how margin, leverage and liquidation thresholds work in more detail.
CVD and Order Flow
Order flow looks more closely at how buying and selling activity is occurring rather than focusing only on the resulting price.
One commonly used metric is Cumulative Volume Delta (CVD). It tracks the cumulative difference between aggressive buying and aggressive selling, typically based on market orders executed at the ask versus the bid.
Traders can use CVD to assess whether buyers or sellers appear to be taking the initiative.
They may also compare spot CVD and perpetual futures CVD. For example, price rising alongside strong perpetual buying but weaker spot participation can provide different context from a move driven by persistent spot demand.
Divergence between price and CVD can also highlight situations where price continues moving despite weakening aggressive participation.
However, order-flow data has an important limitation: crypto liquidity is fragmented across exchanges. CVD from one venue does not necessarily represent activity across the entire market. It should therefore be treated as another source of context rather than a complete picture of buying and selling pressure.
How to Build a Crypto Trade Using Technical Analysis
Technical analysis becomes useful when individual signals are turned into a repeatable trading process. A simple framework is:
- Identify the market regime.
- Mark market structure and key levels.
- Define the setup.
- Look for confirmation.
- Set the invalidation point.
- Define the target and calculate risk/reward.
For this section, we'll use a hypothetical Bitcoin setup where BTC is trending higher and approaching a well-defined resistance zone.
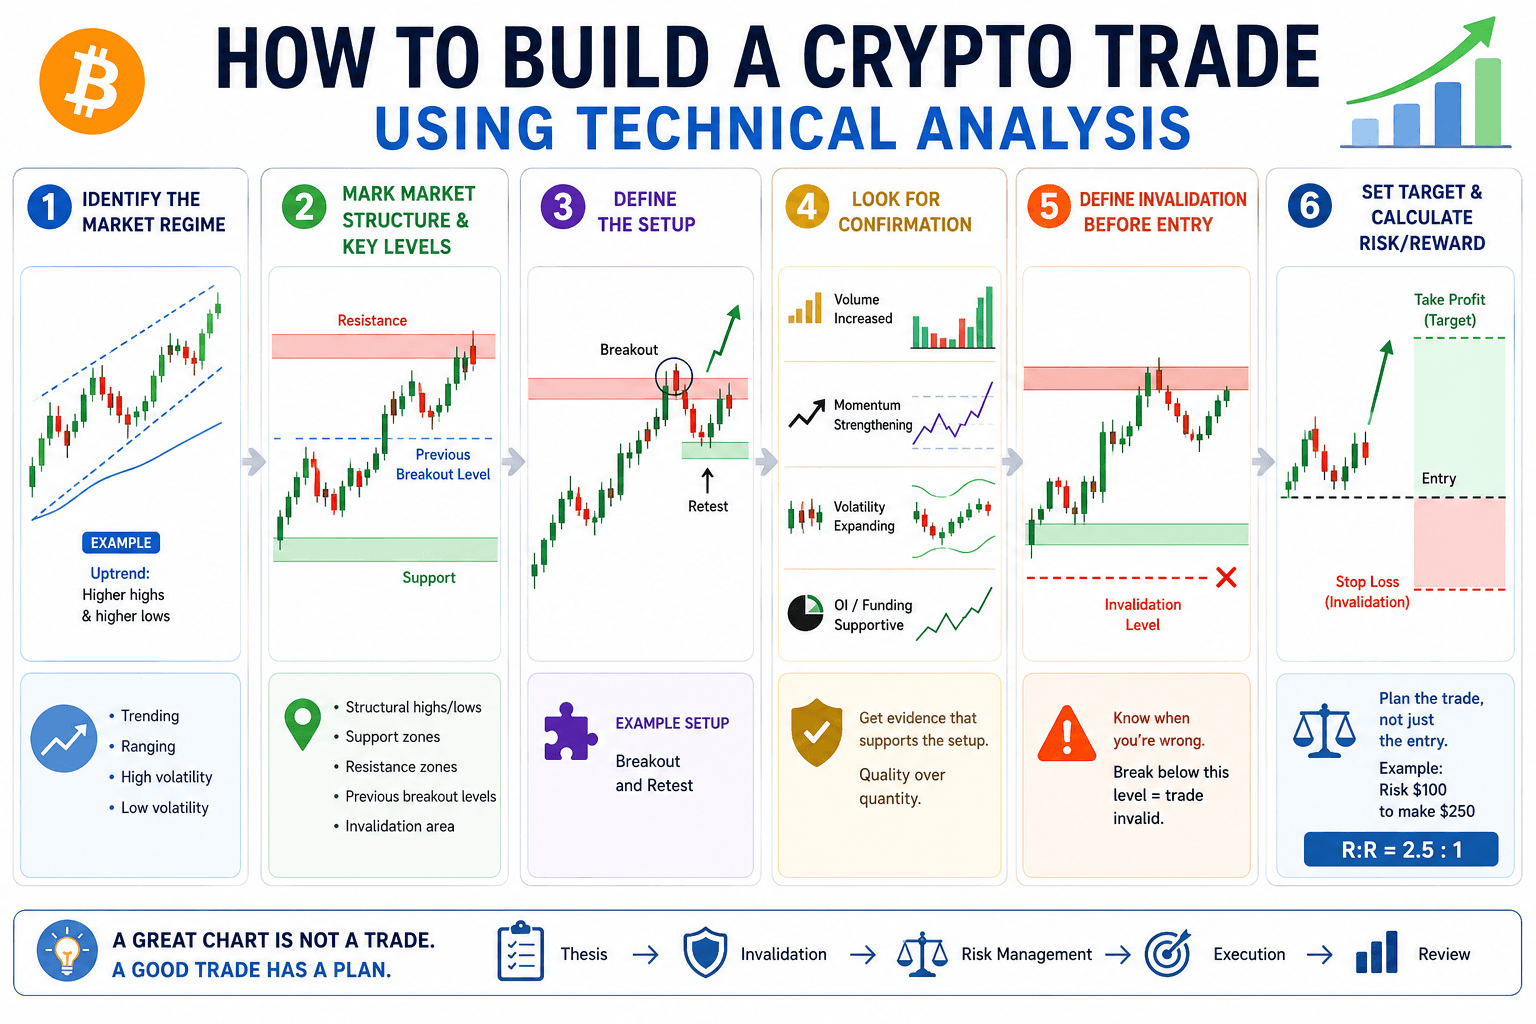 Technical Analysis Helps Traders Build Structured Setups With Clear Entries, Confirmation And Risk Levels
Step 1: Identify the Market Regime
Start by determining the broader environment.
Is Bitcoin:
- Trending
- Ranging
- Highly volatile
- Trading in a compressed, low-volatility range
Suppose BTC is producing higher highs and higher lows on the higher timeframe. That provides a bullish directional backdrop, although it does not automatically justify entering a long position.
Step 2: Mark Market Structure and Key Levels
Next, identify the areas that could influence the trade.
These may include:
- Structural highs and lows
- Support zones
- Resistance zones
- Previous breakout levels
- Areas where the setup would become invalid
In our example, BTC is approaching resistance formed by a previous swing high. Rather than buying simply because the broader trend is bullish, the trader can wait to see how price interacts with that level.
Step 3: Define the Setup
A trade should be based on a recognizable setup rather than a collection of disconnected signals.
Common examples include:
- Trend continuation: Entering in the direction of an established trend after a pullback or consolidation
- Breakout and retest: Waiting for price to break an important level and then hold it on a retest
- Range rejection: Trading a reaction from established support or resistance within a range
Suppose Bitcoin closes above resistance and subsequently retests the former resistance zone as support. The potential setup is now a breakout and retest, rather than Bitcoin appearing to be bullish.
Our guide to crypto trading strategies covers broader approaches such as swing trading, trend trading and other trading styles.
Step 4: Look for Confirmation
The trader can then assess whether other evidence supports the setup.
Potential confirmation may come from:
- Price maintaining bullish market structure
- Increased volume during the breakout
- Momentum strengthening
- Volatility expanding after a period of compression
- Open interest, funding or other derivatives data providing useful context
More indicators do not automatically mean more confirmation. RSI, Stochastic RSI and another momentum oscillator may all be responding to the same underlying price behavior.
In the Bitcoin example, a breakout accompanied by stronger volume and a successful retest may provide more useful confirmation than stacking several similar indicators.
Step 5: Define Invalidation Before Entry
Before entering, ask:
What specific market behavior would show that this trade thesis is wrong?
For a breakout-and-retest setup, invalidation might occur if Bitcoin loses the reclaimed support zone and moves decisively back into its previous range.
This gives the trade a logical stop-loss area based on market structure.
The stop should not simply be moved farther away because price is approaching it. If the market reaches the point that invalidates the original thesis, the reason for taking the trade has changed.
Step 6: Set the Target and Calculate Risk/Reward
Finally, define what the trade could realistically return relative to the amount being risked.
The trader should establish:
- A potential entry price
- A stop-loss or invalidation level
- A possible take-profit target
- The amount of capital at risk
- The potential reward
- Whether the resulting risk/reward fits the trading strategy
For example, if the distance from entry to the stop represents $100 of potential loss and the target offers $250 of potential profit, the setup has a 2.5:1 reward-to-risk ratio before accounting for fees, slippage and other trading costs.
A technically attractive chart is not automatically a good trade. The setup still needs a clear thesis, defined invalidation and a risk profile that fits the trader's rules.
Risk Management for Technical Traders
Technical analysis can help identify potential entries and exits, but risk management determines how much damage a failed setup can do. A trader should know the maximum acceptable loss before entering a position, not after the market moves against them.
Our guide to crypto risk management covers additional techniques for controlling losses, leverage and overall portfolio exposure.
Where Should a Stop-Loss Go?
A stop-loss should generally sit where the original trade thesis becomes invalid.
For example, if a long position depends on a reclaimed support zone holding, a decisive break back below that area may invalidate the setup. This is more useful than choosing an arbitrary stop, such as 5%, without considering market structure.
Volatility also needs to be considered. A stop placed too close to the entry can be triggered by normal price movement even if the broader setup remains intact.
One way traders account for this is with Average True Range (ATR), which estimates recent volatility. ATR can help provide context for whether a proposed stop is unusually tight or wide relative to current market conditions.
How Position Sizing Works
Position sizing determines how much capital is exposed based on the trader's chosen risk limit.
The basic formulas are:
Capital at risk = Account size × Risk percentage
Position size = Capital at risk ÷ Risk per unit
For example:
- Account size: $10,000
- Maximum risk per trade: 1%
- Maximum capital loss: $100
- Entry price: $100
- Stop-loss: $95
- Risk per unit: $5
- Position size: 20 units
If the stop is reached, the theoretical loss is approximately $100 before trading costs.
Real execution can differ because of:
- Fees
- Slippage
- Leverage
- Funding costs
- Contract specifications
- Gaps or rapid price movement
Position sizing should therefore leave room for actual execution rather than assuming every order fills at the exact planned price.
Risk/Reward Ratio and Expectancy
The risk/reward ratio compares the amount a trader could lose with the potential return if the target is reached.
For example, risking $100 for a potential $200 gain gives a 2:1 reward-to-risk ratio.
That number alone does not determine whether a strategy is profitable. Traders also need to consider:
- Win rate
- Average winning trade
- Average losing trade
- Trading costs
- Frequency of trades
Expectancy combines these variables to estimate the average result a strategy produces over many trades.
A strategy can have a high win rate and still lose money if its losing trades are much larger than its winners. Likewise, a lower-win-rate strategy can be profitable if average gains substantially exceed average losses.
There is no universal risk/reward ratio that works for every trading strategy.
When Not to Trade
Sometimes the strongest risk-management decision is simply not taking the trade.
Reasons to stay out can include:
- Unclear market structure
- Low liquidity
- Unusually wide bid-ask spreads
- No defensible invalidation level
- Weak potential reward relative to the risk
- Conflicting technical signals
- Major scheduled volatility without a defined plan
Technical analysis does not require traders to constantly hold a position. If a setup cannot be clearly defined and the downside cannot be controlled, passing on it can be part of the strategy.
Does Technical Analysis Work in Crypto?
Technical analysis can help structure probabilistic trading decisions, but no indicator or pattern consistently predicts crypto prices with certainty.
Its value comes from creating a repeatable framework for interpreting market behavior, defining risk and testing whether a trading approach has historically produced useful results.
What Technical Analysis Can Do
Technical analysis can help traders:
- Organize market information
- Identify trends, support and resistance
- Establish repeatable trading rules
- Define entry, exit and invalidation levels
- Quantify potential risk
- Compare different trade setups
- Test how specific rules behaved historically
Used properly, TA is less about "calling the next move" and more about making decisions under uncertainty.
What Technical Analysis Cannot Do
Technical analysis cannot:
- Guarantee future price movements
- Anticipate every news or macro event
- Eliminate losing trades
- Turn a poorly tested strategy into an edge
- Make illiquid or easily manipulated markets predictable
Even a historically reliable setup can fail on the next trade. That is why technical analysis and risk management need to work together.
Backtesting Before Trusting a Strategy
A trading rule should be tested before traders assume that it provides an edge.
Important considerations include:
- Sample size: A handful of successful trades is not enough to establish reliability.
- In-sample data: The historical data used to develop or optimize the strategy.
- Out-of-sample testing: Different data used to see whether the strategy still performs after development.
- Transaction costs: Fees and funding costs can reduce apparently profitable results.
- Slippage: Actual execution prices may differ from backtested assumptions.
- Overfitting: A strategy can be tuned so closely to historical data that it performs poorly in new conditions.
- Market regimes: A strategy that performs well in a strong trend may struggle in a range or bear market.
- Look-ahead and survivorship bias: Poor testing methods can accidentally use information that would not have been available at the time or exclude assets that later disappeared.
Backtesting does not guarantee future performance. It does, however, provide more useful evidence than selecting an indicator because it looks convincing on a historical chart.
For a practical walkthrough of data selection, strategy rules, transaction costs and common testing errors, see our guide on how to backtest a crypto trading strategy.
Why Crypto Technical Analysis Can Fail
Technical analysis becomes less reliable when:
- Liquidity is thin
- Bid-ask spreads are wide
- Leverage is excessive
- Liquidations accelerate price moves
- Market data differs significantly across exchanges
- Volume is unreliable
- Traders force patterns to fit a preferred view
- Indicators are stacked without adding independent information
These weaknesses do not make TA useless, but they can reduce the reliability of otherwise familiar setups.
Low Liquidity and Small-Cap Cryptocurrencies
Technical analysis generally works better when there is enough liquidity for price discovery to be meaningful.
In thin markets, traders may encounter:
- Shallow order books
- Larger bid-ask spreads
- Higher slippage
- Exaggerated wicks
- Breakouts caused by relatively small orders
- Difficulty exiting positions at the expected price
This is particularly relevant for small-cap cryptocurrencies, where a move through support or resistance may reflect limited liquidity rather than a broad change in market participation.
Crypto markets trade 24/7, but liquidity, spreads and volatility can still change significantly throughout the day and week. Our guide to crypto trading hours explores these shifts in more detail.
Leverage and Liquidation Cascades
Crypto derivatives markets can amplify price moves through leverage.
When large numbers of leveraged positions are clustered around similar levels, a sharp move can trigger forced liquidations. Those liquidations can push price further in the same direction, triggering additional positions and creating a liquidation cascade.
During these events, price can move rapidly through support, resistance or other technically important levels.
A level that has worked repeatedly in normal conditions may therefore offer little protection during a highly leveraged unwind.
Market Fragmentation and Manipulation
Crypto trading is spread across multiple exchanges and liquidity pools rather than one centralized market.
This can create differences in:
- Price
- Trading volume
- Order-book depth
- Wicks and local highs or lows
- Available liquidity
A breakout visible on one exchange may look less convincing on another.
Order-book data also has limitations. Orders can be added or removed before execution, so visible buy and sell walls do not always represent genuine demand.
Less-liquid markets can also be more vulnerable to manipulation, including pump-and-dump activity and misleading volume. Traders should therefore be especially cautious when applying technical signals to assets with weak liquidity or questionable market data.
Confirmation Bias and Indicator Overload
Sometimes the weakness is not the market. It is the analysis.
Confirmation bias can lead traders to search for evidence supporting a view they already hold. This can include:
- Finding a chart pattern because they expect price to rise or fall
- Changing indicators until one produces the desired signal
- Using several correlated indicators and treating them as independent confirmation
- Moving a stop-loss after the trade moves against them
- Changing the original trading rules after entering a position
A chart filled with indicators does not automatically produce better analysis.
The stronger approach is to define the setup, confirmation criteria and invalidation rules before entering. If the market no longer fits those conditions, changing the analysis to defend the existing position defeats the purpose of having a technical process in the first place.
These problems are closely tied to trader behavior. Our guide to crypto trading psychology covers confirmation bias, FOMO, overtrading and other behavioral errors that can undermine a trading plan.
How Technical Analysis Fits With Other Crypto Research
Technical analysis is most useful when it is not treated as the only source of information. Traders can combine price-based analysis with fundamentals, on-chain data and derivatives positioning to build a broader view of the market.
| Analysis type | Primary question |
|---|---|
| Technical | What is price doing? |
| Fundamental | Why might the asset have value? |
| On-chain | What is happening on the blockchain? |
| Derivatives positioning | How are leveraged traders positioned? |
Technical Analysis and Fundamental Analysis
Fundamental analysis looks at the underlying asset rather than the chart.
For crypto, that can include:
- Network fundamentals
- Tokenomics
- Adoption
- Protocol activity
- Upcoming catalysts
- Broader valuation or investment thesis
Technical analysis can then help with timing. An investor may like an asset fundamentally but still wait for stronger market structure, a better entry level or a clearer risk setup before taking a position.
Technical Analysis and On-Chain Data
On-chain analysis can add context that price and volume alone may not provide.
Traders may look at:
- Exchange inflows and outflows
- Holder behavior
- Realized price or cost-basis metrics
- Network activity
These metrics can help show how participants are behaving on the blockchain, but they should still be interpreted alongside market conditions rather than treated as automatic trading signals.
Technical Analysis and Market Positioning
Derivatives data can also complement price-based analysis.
Metrics such as:
- Open interest
- Funding rates
- Liquidations
can help show how leverage and positioning are changing around a technical setup.
For example, a breakout occurring alongside rapidly rising open interest and extreme funding can carry different risks from a similar breakout with relatively neutral derivatives positioning.
The goal is not to stack every available dataset. It is to use each type of analysis to answer a different question and build a more complete trading thesis.
A Crypto Technical Analysis Checklist
A technical analysis process should be repeatable. Before entering a trade, traders can work through the following checklist:
- Identify the broader market regime.
- Read the market structure.
- Mark significant support and resistance zones.
- Check market participation and volatility.
- Choose technical indicators that answer distinct questions.
- Look for a defined setup rather than reacting to a random signal.
- Check higher-timeframe alignment.
- Review relevant derivatives positioning where useful.
- Define the invalidation level before entering.
- Calculate position size and potential loss.
- Compare the potential reward with the risk.
- Skip the trade if the setup does not satisfy the rules.
The purpose of a technical analysis checklist is not to make every trade look attractive. It is to create consistency, reduce impulsive decisions and make sure market structure, confirmation, position sizing and risk-reward are considered before capital is put at risk.
Crypto Technical Analysis Tools
Technical analysis tools are most useful when chosen for a specific job. Traders generally need charting software for price analysis, derivatives platforms for market positioning, and testing tools for validating strategies.
Charting and Technical Analysis Platforms
A good charting platform should provide:
- Drawing tools
- A broad technical indicator library
- Multi-timeframe layouts
- Trading alerts
- Volume data
- Chart synchronization across devices
TradingView is one of the most widely used charting platforms for crypto and supports extensive indicators, drawing tools and alerts.
Crypto Derivatives Data Platforms
Derivatives data platforms can add context that a standard price chart may not show.
Depending on the platform, traders may be able to monitor:
- Open interest
- Funding rates
- Liquidation data
- Futures volume
- Order flow
Useful options include:
- CoinGlass: Covers open interest, funding rates, futures volume, liquidations and long/short positioning across multiple exchanges.
- Coinalyze: Useful for comparing open interest, funding and derivatives-market activity across crypto markets.
These tools are especially useful for understanding leverage and positioning around a technical setup. They should complement price analysis rather than replace it.
Paper Trading and Backtesting Tools
Paper trading allows traders to test setups without putting meaningful capital at risk, while backtesting checks how a set of rules would have performed on historical data.
Both can help traders evaluate:
- Whether the strategy is clearly defined
- How often signals occur
- Win rate and average gain or loss
- Drawdowns
- Performance across different market regimes
- The effect of fees and slippage
Some options include:
- CoinQuant: A crypto-focused, no-code option for running historical backtests and reviewing metrics such as drawdown, profit factor and trade history.
- Jesse: An open-source Python framework aimed at more technical users who want greater control over crypto strategy development and backtesting.
Testing does not guarantee future results, but it provides a stronger foundation than relying on a strategy simply because it looks convincing on a chart.

Final Thoughts on Crypto Technical Analysis
Technical analysis is best used as a framework for interpreting market behavior and making structured trading decisions, not as a prediction machine.
Market structure, trend and context should come before stacking technical indicators. In crypto, traders can also use derivatives data such as open interest, funding rates and liquidations to add context that conventional TA may miss.
Every trade should have a clear invalidation point and defined risk before entry. Indicators, chart patterns and trading strategies should also be tested rather than trusted simply because they look convincing on historical charts.
Sometimes, the strongest conclusion technical analysis can produce is simple: there is no trade worth taking right now.