Crypto moves fast, and staying ahead of the curve means having the right tools in your corner.
Whether you're a day trader glued to charts, a long-term investor tracking token fundamentals, or just someone trying to figure out what the whales are up to, good research tools can make all the difference. But not all platforms are built the same. Some offer flashy dashboards with shallow data. Others bury gold under layers of complexity.
This guide cuts through the noise and breaks down the best crypto analysis tools out there, so you can spend less time digging and more time making smarter moves.
Key Takeaways
The top crypto research tools include Glassnode for institutional-grade on-chain analytics, Nansen for labeled wallet tracking and Smart Money insights, Arkham for entity-based intelligence and wallet deanonymization, and CoinGecko for comprehensive price data and exchange metrics.
Other essential platforms are CoinMarketCap for token rankings and historical price data, LunarCrush for social sentiment and influencer metrics, Santiment for behavioral and development analytics, and TradingView for advanced charting and technical analysis.
Token Terminal excels at delivering standardized financial metrics across protocols, while DeBank offers real-time wallet analytics and Web3 social tools, and Zapper provides cross-chain portfolio tracking with human-readable activity feeds.
No tool offers everything—so combining sentiment, on-chain, and technical data is the smartest way to build a full market picture and avoid surface-level signals.
Ease of use, free tier access, and broad asset coverage are key factors when evaluating which tools belong in your stack.
What Makes A Great Crypto Analysis Tool?
Not all crypto tools are built the same. Some are packed with features but hard to use. Others look great but lack solid data.
Here’s what matters:
- Data You Can Trust: You need to know the numbers are right. If the data's off, everything else falls apart. A good tool gives you clean, consistent info that you can trust, whether it’s token prices, on-chain metrics, or wallet activity.
- Real-Time + History: Markets change fast, so live data is a must. But it’s not just about what’s happening now—you also need a look back to spot patterns, compare cycles, and understand long-term trends. The best tools give you both.
- Easy to Use: Even the most powerful tools are useless if they’re hard to use. Clean layouts, simple charts, and a smooth interface make all the difference. You should be able to get what you need without feeling like you’re digging through a spreadsheet.
- Wide Asset Coverage: Bitcoin and Ethereum are just the start. The better tools also cover NFTs, DeFi projects, Layer-2 chains, stablecoins, and smaller altcoins. You want something that lets you go deep on any asset, not just the top five.
- Custom Views and Alerts: Being able to tailor the tool to your needs is huge. Maybe you want to track whale movements, watch token unlocks, or get pinged when something spikes. Tools that let you set your own alerts or dashboards save time and keep you on top of things.
- Free vs. Paid Options: You shouldn’t have to pay just to test the waters. The best tools offer plenty for free—enough to really dig in and learn. If you like what you see, the premium version should add more depth, not just lock away basic stuff.
On-Chain Analytics Platforms
If you want to see what’s really happening under the hood of the blockchain, on-chain analytics tools are your best friend. They let you track wallet activity, follow big money moves, and spot trends that aren’t always obvious on price charts. Here are some of the top platforms that make sense of the raw blockchain data.
Glassnode
Glassnode is a top-tier blockchain data and intelligence platform designed to help investors, traders, and researchers understand the digital asset market with precision. Combining on-chain analytics with off-chain financial data, it delivers unparalleled insights into the wild world of crypto.
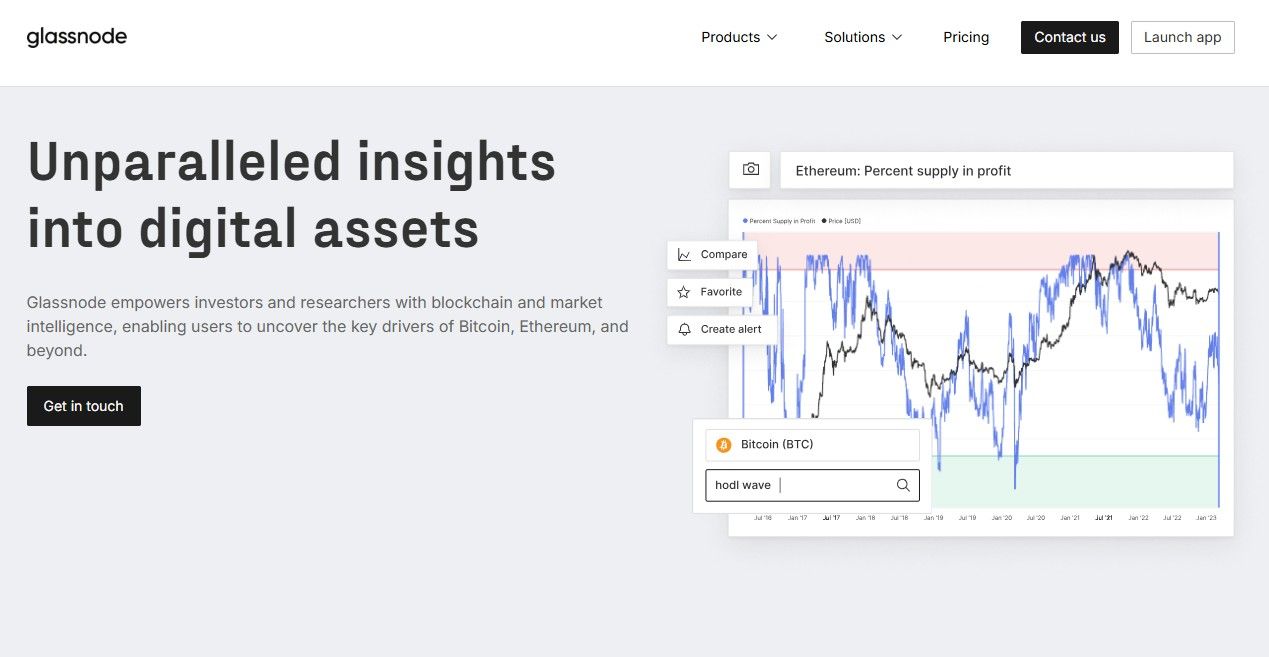 Glassnode Is A Premier Blockchain Data And Intelligence Platform. Image via Glassnode
Features
- On-Chain and Off-Chain Data Integration: Combines blockchain metrics with spot and derivatives market data for a complete view of digital assets.
- Glassnode Studio: An intuitive analytics suite with customizable, no-code dashboards and charts to visualize asset fundamentals and liquidity dynamics.
- Glassnode Insights: Expert-led research hub offering market updates, bespoke analysis, and educational content for deeper market understanding.
- High-Performance API Access: Seamlessly connect with Glassnode’s high-fidelity data for use in trading models, portfolio strategies, and custom dashboards.
- Specialist Metrics and Clustering Algorithms: Proprietary analytics, including wallet clustering and capital flow tracking, offer deeper insights into participant behavior and market structure.
- Institutional-Grade Solutions: Tailored tools and custom research packages designed for fund managers, analysts, and large-scale content producers.
✅ Pros
- Offers deep insights into Bitcoin, Ethereum, and other major crypto assets.
- Trusted by leading institutions in both traditional finance and crypto sectors.
- Easy-to-use dashboards without requiring coding skills.
- Allows users to request custom research and tailored market analysis.
- Built by experts known for innovation in blockchain analytics.
❌ Cons
- Can be overwhelming for beginners unfamiliar with analytics tools.
- Advanced features and historical data require a paid subscription.
Pricing
The standard plan is free. It unlocks on-chain data, giving you access to fundamental network and market metrics.
The advanced plan is perfect for deeper analysis with more advanced on-chain metrics and basic derivatives data. It costs $49 per month when paid for the whole year.
The professional tier, which will set you back $833.33 each month (billed yearly), gives you full access to the most sophisticated on-chain, derivatives, and spot market metrics. You can get your hands on high-resolution data, entity-adjusted metrics, and cutting-edge tools such as immutable point-in-time variants to enhance your trading strategies, risk management, and market analysis.
Best For
Glassnode is ideal for institutional investors, quant traders, and on-chain data analysts.
Nansen
Nansen is one of the most powerful on-chain analytics platforms. Built for investors, analysts, and crypto teams, it takes raw blockchain data and turns it into clear, actionable insights. What makes Nansen special is its ability to label millions of wallets, helping you figure out who’s actually behind the transactions, whether it's a top fund, a project team, or a suspected rug puller.
 Nansen Caters To Investors, Analysts And Crypto Teams. Image via Nansen
Features
- Wallet Labeling at Scale: Over 300 million addresses labeled to help you track whales, funds, insiders, and shady actors with confidence.
- Smart Money Tracking: Follow what the smartest wallets are buying, selling, and farming across 12+ chains.
- Smart Alerts: Set up custom alerts for high-value moves, token transfers, and wallet activity—so you’re never caught off guard.
- Token God Mode: Deep-dive into any token to see top holders, recent trades, and DEX activity all in one place.
- Nansen Query: For developers and quants—get fast, programmatic access to structured on-chain data.
- Nansen Portfolio: Monitor your personal or organizational holdings with real-time portfolio tracking.
- Nansen Research: Access exclusive, professionally written insights covering top projects, market events, and alpha opportunities.
✅ Pros
- 300M+ wallet labels across 10+ chains for detailed address profiling.
- Smart Money tracking helps follow top-performing wallets and funds.
- Real-time alerts for wallet movements, token transfers, and trends.
- Token God Mode offers deep token-level analytics and trade breakdowns.
- Nansen Research provides exclusive, professionally written insights.
- Includes tools for developers like Nansen Query and portfolio tracking.
- Crypto payments accepted; free tier available to try before upgrading.
❌ Cons
- Advanced features require a paid subscription.
- Professional tier is expensive ($999/month, billed annually).
- May feel complex or overwhelming to new users.
- Interpreting data still requires a solid understanding of blockchain activity.
Pricing
Nansen has a basic free version and two paid tiers. You can pay in both fiat and crypto.
- Pioneer: This plan is for serious investors who want deeper insights and smarter tools. It includes full access to Nansen’s 300M+ labeled addresses across 10+ chains, including Smart Money tracking. You’ll get advanced wallet and token analytics, AI-powered market signals, and personalized features to optimize your research. Table filtering by custom labels and Smart Money makes it easy to spot trends and act fast. The price? $99 per month (billed yearly).
- Professional: Built for funds and full-time investors, this plan unlocks everything in Pioneer plus the full Nansen experience. You’ll get unlimited personalization, CSV downloads, early access to new features, and a dedicated Customer Success Manager. Annual subscribers can also apply to join the Alpha Community for exclusive insights. On top of that, you’ll be among the first to use the upcoming Nansen AI Agent. This plan costs $999 per month (billed yearly).
Best For
Nansen excels at helping active investors, DeFi traders, and wallet behavior trackers.
Arkham Intelligence
Often described as the "Bloomberg Terminal of Crypto," Arkham Intelligence takes the overwhelming transparency of Web3 and turns it into something actionable. By focusing on entity-based intelligence, Arkham connects wallets, transactions, and behaviors to real identities and organizations, giving users a new lens to view crypto activity.
Our full Arkham Intelligence review goes more in-depth than what's included here.
 Arkham Is Often Described As The Bloomberg Terminal of Crypto. Image via Arkham
Features
- Entity-Based Intelligence: Arkham doesn’t just track wallet addresses, it links them to real-world identities and organizations, showing you the “who” behind the transactions.
- Ultra AI: Arkham’s proprietary AI engine aggregates on-chain and off-chain data into structured, human-readable profiles, surfacing over 800 million wallet labels across 450,000+ entities.
- Dashboard: A customizable interface inspired by traditional market terminals. Includes real-time data on transactions, token activity, and market sentiment across supported chains.
- Intel Exchange: A marketplace where users can buy and sell blockchain intelligence using ARKM tokens. Intel seekers post bounties, and providers respond with verified submissions.
- Visualizer Tool: Turn wallet activity into an interactive visual map to trace connections, counterparties, and fund flows—ideal for researchers and sleuths.
- Token Pages & Profiles: Track top holders, token flows, DEX activity, and inflow/outflow trends on token-specific pages. Get detailed views of investor portfolios and project behavior.
- Alerts & Alerter: Set up custom alerts for wallet activity, DEX swaps, token inflows/outflows, and more.
- Arkham Oracle: Ask natural-language questions (like ChatGPT) to surface blockchain intelligence directly from the Arkham dataset.
- Multi-Chain Support: Arkham supports 15+ major blockchains, including Bitcoin, Ethereum, Solana, Arbitrum, BNB Chain, Optimism, Base, and more.
- API Access & Tracer Tools: Advanced users can use Arkham’s API for programmatic access, or use Tracer to follow money trails across multiple wallets and chains.
✅ Pros
- Links blockchain activity to real-world entities for deeper intelligence.
- AI-driven profiling offers over 800 million wallet labels across 450,000+ identities.
- Customizable dashboards provide a terminal-style experience with real-time data.
- Intel Exchange lets users monetize and crowdsource blockchain investigations.
- Powerful visual tools help trace wallet interactions and fund movements.
- Multi-chain support across Bitcoin, Ethereum, Solana, and 12+ other blockchains.
- Natural-language queries make intelligence accessible without technical knowledge.
- Advanced users can leverage APIs and Tracer tools for in-depth forensics.
❌ Cons
- Interface and feature set may be overwhelming for casual users or beginners.
- Requires ARKM tokens to participate in the Intel Exchange marketplace.
- Some advanced tools and historical insights may be gated behind subscription tiers.
Best For
Arkham is most suited for investigators, researchers, and transparency-focused traders.
Did you know? Arkham has launched a crypto exchange that's operational in most of the U.S. Read our full Arkham Exchange review.
Market Data Aggregators
When you just want the numbers, like prices, charts, and rankings, without diving into deep analytics, market data aggregators are your go-to. These platforms offer a bird’s-eye view of the crypto market, helping you track token prices, compare projects, and spot trends in real time.
CoinGecko
Whether you're deep in the weeds of DeFi or just checking the price of Bitcoin over coffee, CoinGecko is probably one of the first tabs you open. Launched in 2014, this OG crypto data aggregator has evolved into a powerhouse, bringing token prices, exchange data, NFT stats, and research reports together in one intuitive dashboard.
This barely scratches the surface. If you'd like to learn more, read our full CoinGecko review.
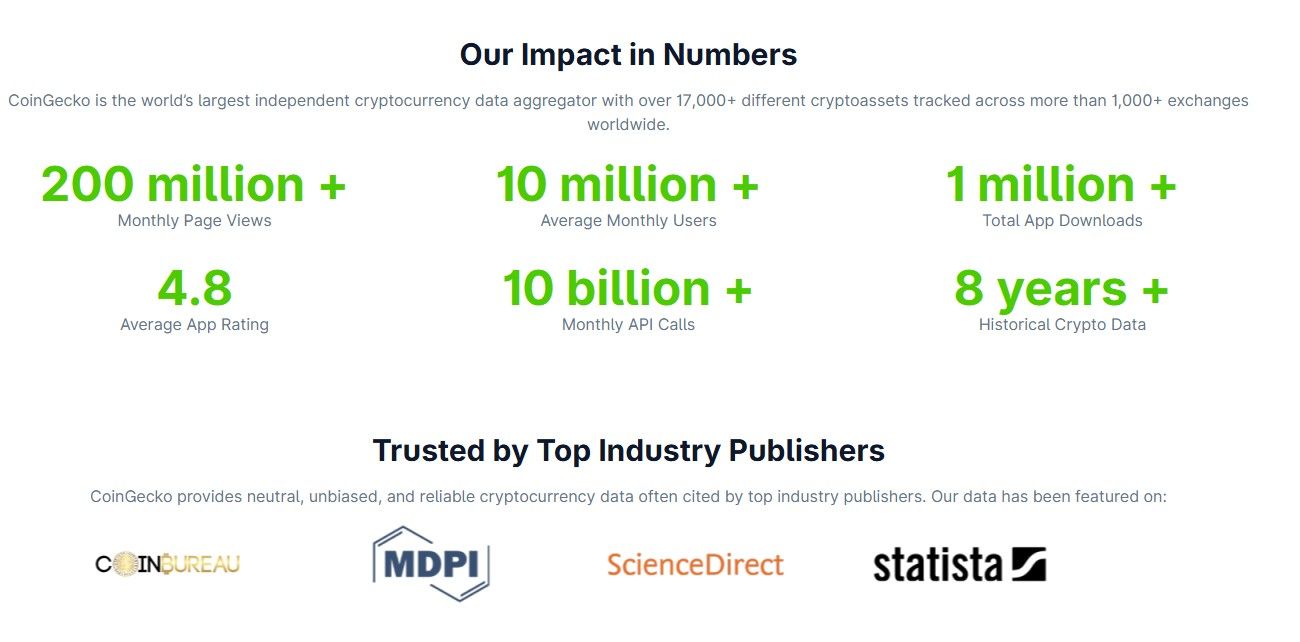 CoinGecko Is The OG Crypto Data Aggregator. Image via CoinGecko
Features
- Market Data Aggregation: Real-time price, volume, and market cap data across 17,000+ tokens and 1,200+ exchanges
- Trust Score System: Ranks centralized exchanges based on liquidity, API coverage, security, and proof-of-reserves
- GeckoTerminal: DEX tracking across 200+ ecosystems with up-to-date pool data
- NFT Floor Price Tracker: Monitors floor prices across leading NFT marketplaces
- Portfolio Tracker: Multi-portfolio setup to track coins and NFTs (manual entry required)
- Educational Content: Tutorials, glossaries, and beginner guides for users of all levels
- Public + Premium APIs: Widely used in the industry, offering deep access to price, token, and NFT data
- Quarterly Research Reports: Deep-dive analysis of market trends, hot narratives, and regional adoption
- Crypto Widgets: Embeddable real-time price and comparison tools for websites
✅ Pros
- Offers real-time price, volume, and market cap data for over 17,000 tokens and 1,200+ exchanges.
- Includes DEX tracking, NFT floor price data, and a multi-portfolio tracker in one dashboard.
- Trust Score system helps users evaluate centralized exchanges by key metrics like liquidity and security.
- Public and premium APIs are widely integrated across the crypto ecosystem.
- Free to use with a very affordable ad-free premium tier.
- Features regular research reports and educational tools for traders and beginners alike.
- Widgets and tools are embeddable for developers and content creators.
❌ Cons
- Portfolio tracker requires manual entry, which can be time-consuming for active traders.
- Some data (like certain exchange volumes) may still be subject to inaccuracies or spoofing.
- Premium plan offers minimal extra features beyond ad removal and newsletter access.
Pricing
CoinGecko is free to use. However, there is a paid plan ($10 each month with discounts if you pay for the whole year) that removes ads and unlocks the premium newsletter. You'll have to shell out for the API, too. For the most updated pricing, check out the CoinGecko API pricing page.
Best For
CoinGecko is ideal for users who want a clean, ad-free interface, DEX and NFT market tracking, and unfiltered data from both centralized and decentralized sources.
CoinMarketCap
CoinMarketCap is one of the most widely used platforms for tracking cryptocurrency prices, market caps, and rankings. Launched in 2013 and later acquired by Binance, it has become a go-to resource for both new and experienced crypto users. CMC offers real-time data on thousands of crypto assets, exchanges, DeFi tokens, NFTs, and more.
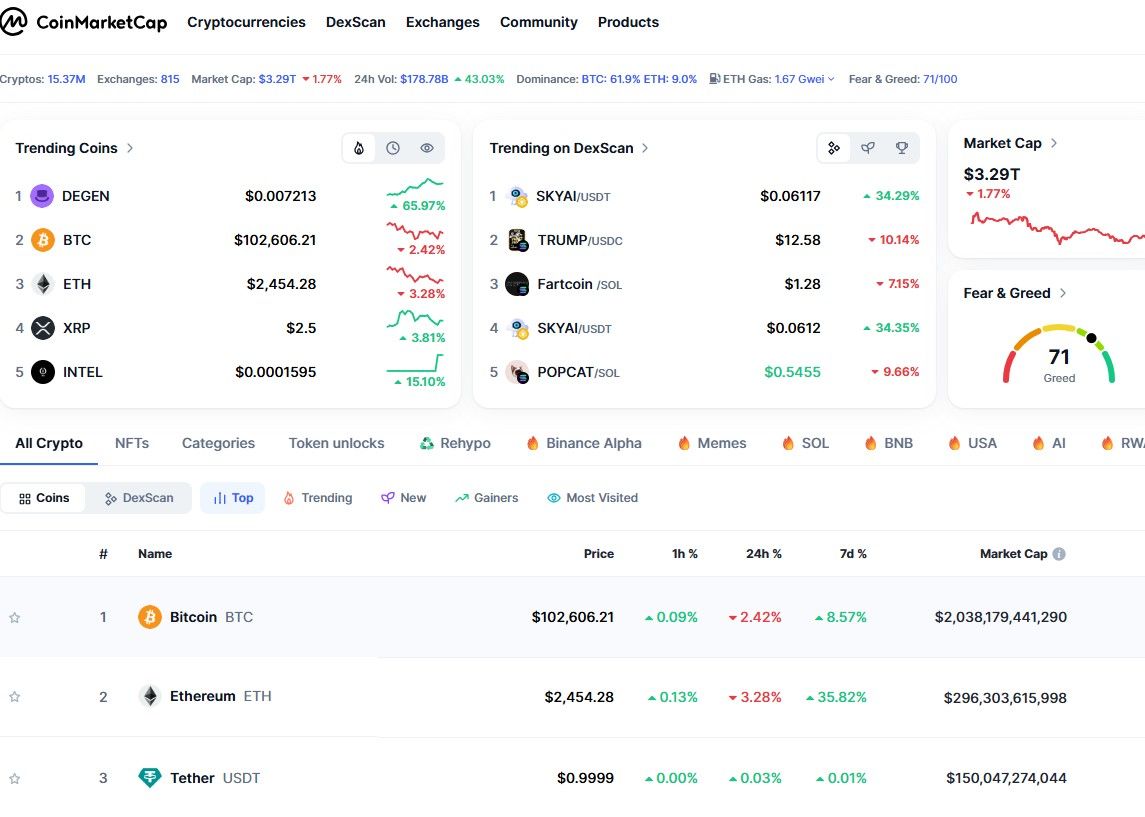 CMC Is One Of The Most Widely Used Platforms For Tracking Crypto Prices. Image via CoinMarketCap
Features
- Live Price Tracking: Get real-time price updates for over 25,000 cryptocurrencies, including trading volume, market cap, circulating supply, and historical data.
- Market Rankings: View top-performing coins, trending tokens, gainers and losers, and newly listed assets across centralized and decentralized exchanges.
- Exchange Data: Compare exchange volumes, liquidity scores, and user ratings for hundreds of CEXs and DEXs.
- Token Information Pages: Each crypto asset has a dedicated page with price charts, contract addresses, project descriptions, social links, and community ratings.
- Crypto Education (CMC Learn): Browse beginner-friendly guides, quizzes, and tutorials on crypto basics, DeFi, NFTs, and blockchain technology.
- Portfolio Tracker: Track your holdings manually or by connecting wallets to monitor gains, losses, and asset allocations.
- Token Screeners: Filter and sort tokens based on categories, performance metrics, consensus mechanisms, and more.
- CMC Earn & Airdrops: Learn about new tokens through video lessons and earn small rewards or participate in free token giveaways.
- API Access: Developers and businesses can integrate live crypto data into apps and dashboards with CMC’s professional-grade API.
- News & Community Updates: Stay updated with curated news feeds, social media mentions, and community sentiment around major coins.
✅ Pros
- Tracks over 25,000 cryptocurrencies with real-time price, volume, and market cap data.
- Detailed token pages include price charts, social links, and community ratings.
- Wide selection of filters, screeners, and rankings to analyze market movements.
- Offers tools like portfolio tracker, CMC Earn, airdrops, and token screeners.
- Educational section (CMC Learn) helps onboard beginners to crypto concepts.
- API access supports integration of professional-grade data into apps and tools.
- Popular and widely used, making it a familiar interface for most crypto users.
❌ Cons
- Owned by Binance, which may raise concerns about neutrality or data bias for some users.
- Portfolio tracking tool still requires manual effort or wallet integration.
- Ads and promotions can clutter the user interface, especially for free users.
- Some users report occasional delays or discrepancies in volume data from smaller exchanges.
Pricing
CoinMarketCap is free to use. However, if you'd like access to the API, you'll need to pay up. You can head over to the API pricing page to find out more.
Best For
CoinMarketCap is best suited for users who want a high-level overview of the crypto market and access to popular metrics and rankings in one place.
Fundamental and Sentiment Analysis Tools
Price charts only tell part of the story. If you really want to understand what’s moving the market, you need to look under the hood — at developer activity, whale movements, and social chatter. That’s where fundamental and sentiment tools come in. These platforms help you track what people are building, saying, and doing across the crypto space.
LunarCrush
LunarCrush is your all-in-one social intelligence platform for crypto and financial markets. It delivers real-time insights into what’s trending, who’s influencing the conversation, and how social sentiment is impacting asset performance.
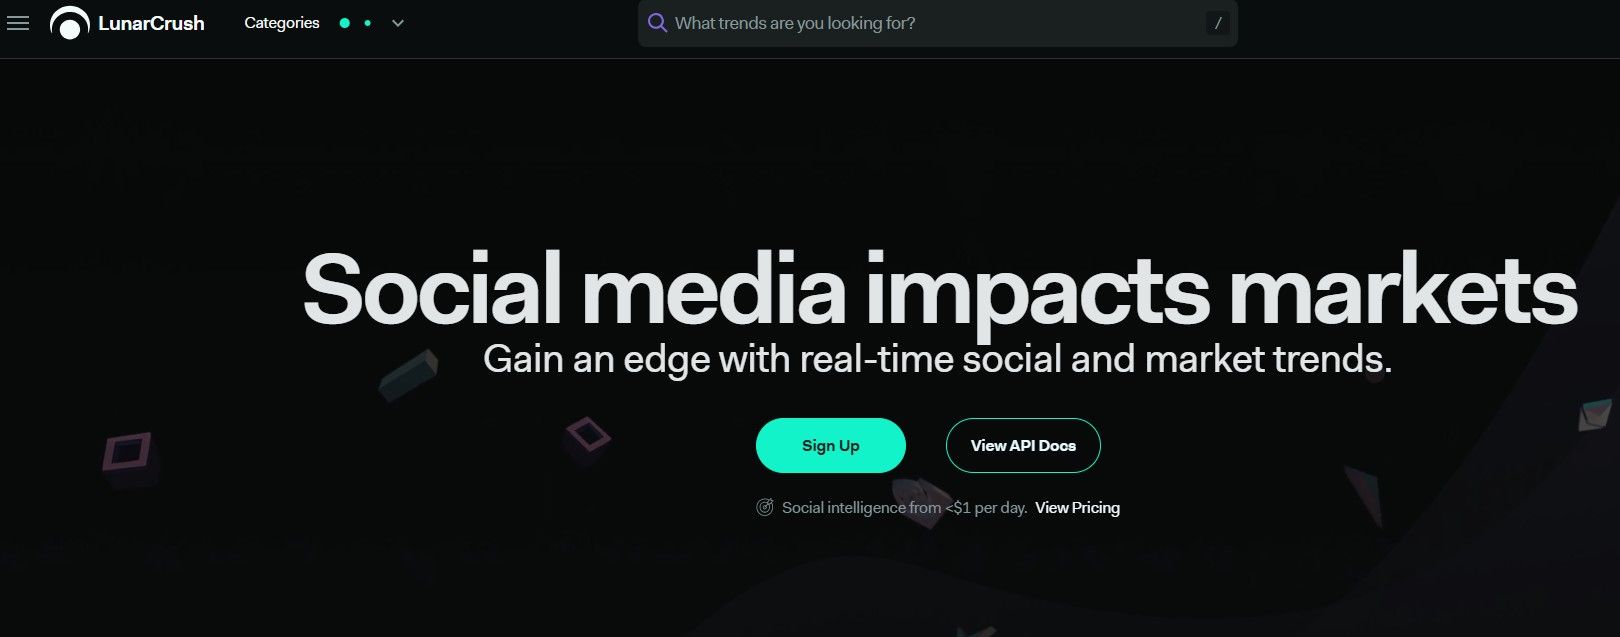 LunarCrush Is An All-In-One Social Intelligence Platform. Image via LunarCrush
Features
- Real-Time Social Search: Instantly surface live conversations, trends, and sentiment changes across social platforms.
- AI Companion: Get AI-powered insights into why market trends are emerging and where attention is shifting.
- Customizable Home Screen: Personalize your feed with your favorite assets, creators, and categories for a focused experience.
- Trending Topics: Discover market narratives gaining traction before they go mainstream.
- Creator Rankings: Identify key influencers by analyzing engagement, reach, and impact across social platforms.
- Asset Comparison Tools: Analyze multiple assets side-by-side using both social and market data.
- Social Metrics Suite: The Social Metrics Suite from LunarCrush offers powerful tools to gauge market momentum through community activity. AltRank combines market performance with social activity to rank crypto assets more holistically. Galaxy Score evaluates the overall strength of a cryptocurrency by analyzing both social and market indicators. Additional metrics like Mentions, Engagements, Sentiment, and Social Dominance help track community buzz, user momentum, and the overall health of conversations surrounding specific assets.
✅ Pros
- Tracks real-time social trends and sentiment across major crypto assets.
- AI-powered insights help explain emerging market narratives and attention shifts.
- Customizable dashboards let users tailor their data feed to specific interests.
- Unique metrics like AltRank and Galaxy Score provide a combined view of social and market performance.
- Influencer analytics reveal who’s driving conversations and engagement.
- Asset comparison tools enable side-by-side analysis using both social and price data.
- Offers developer-focused plans with enhanced API access for integration.
❌ Cons
- Focus on social data may not appeal to users seeking purely financial or technical analytics.
- Advanced features and full data access require a paid subscription.
- Interface can feel crowded for first-time users due to the volume of available metrics.
- Enterprise plan pricing is not publicly disclosed and may be cost-prohibitive for smaller teams.
Pricing
LunarCrush offers three pricing plans to fit different needs. The Individual plan starts at $24/month (billed annually) and provides access to social and market metrics. The Builder plan, at $240/month, adds enhanced API access for developers. For larger teams, the Enterprise plan offers custom pricing with premium API access, support, and team features. Discounts are available for annual and bi-annual billing.
Best For
LunarCrush is best suited for social-driven traders, influencers, and marketers who want to understand how community sentiment, trending narratives, and key voices impact asset prices.
Santiment
Santiment is a leading behavioral analytics platform for crypto investors, traders, and builders. It turns raw blockchain, social, and market data into actionable insights. With tools built for everyone from hedge fund managers to NFT creators, Santiment simplifies complex crypto analysis and reveals the story behind market behavior.
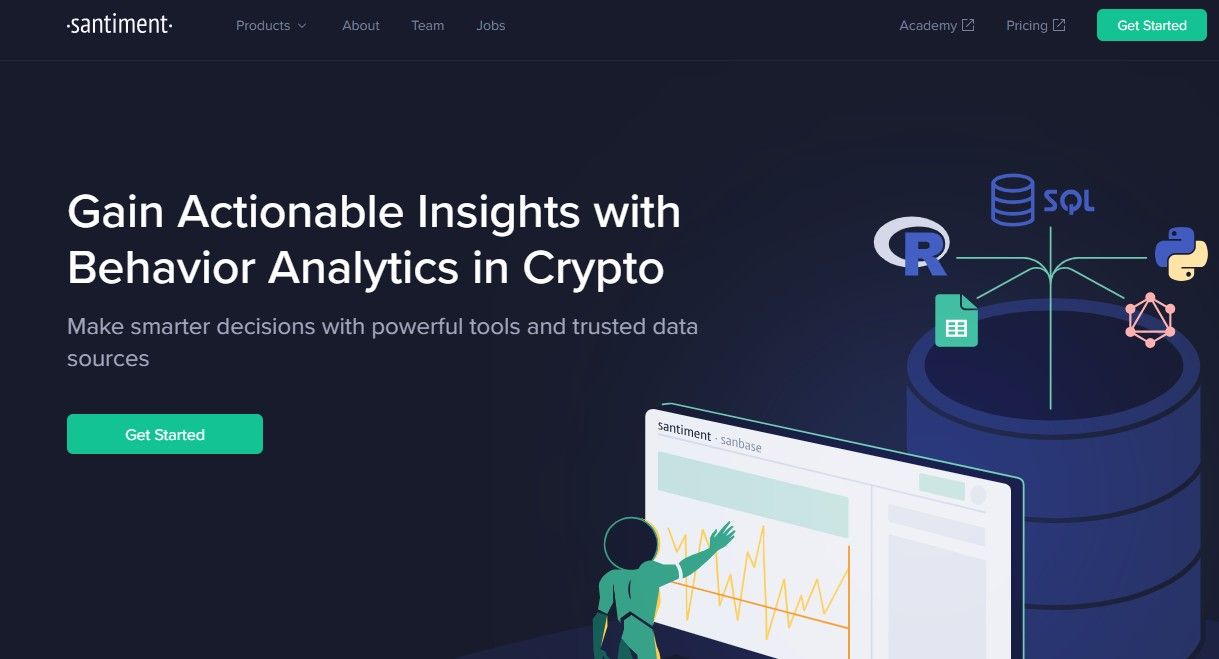 Santiment Is A Behavioral Analytics Platform. Image via Santiment
Features
- All-in-One Crypto Intelligence Platform: Combines social, on-chain, developer, and financial metrics in one powerful dashboard.
- Extensive Data Coverage: Track 2,500+ assets across 12 blockchains with over 1,000 on-chain metrics and historical data going back to 2009.
- Social Metrics: Discover trending crypto topics and sentiment shifts across platforms in real-time.
- On-Chain Metrics: Analyze trader behavior, profit/loss zones, exchange flows, and address activity.
- Whale & Stakeholder Insights: Track top holders, whale wallets, and token distribution patterns.
- NFT Metrics: Monitor mentions, popularity, and community traction of NFT collections.
- Custom Dashboards & Alerts: Build personalized workspaces with screeners, watchlists, and chart layouts.
- Developer-Friendly API: Seamlessly integrate Santiment data into your own apps, models, or quant pipelines.
- Trusted and Transparent: Backed by years of historical data, consistent analysis, and a strong community following.
✅ Pros
- Combines on-chain, social, developer, and financial data in one unified platform.
- Tracks over 2,500 assets across 12 blockchains with deep historical coverage dating back to 2009.
- Real-time social and sentiment tracking reveals emerging narratives and market buzz.
- Advanced whale tracking and stakeholder analytics provide insights into token movements and accumulation patterns.
- Supports NFT trend tracking and analysis for creators and collectors.
- Custom dashboards and alert systems enable personalized market monitoring.
- Robust API support makes it ideal for quant models, research teams, and developers.
- Free tier available for newcomers with access to essential analytics tools.
❌ Cons
- Pro and Max plans can be expensive for individual traders or casual users.
- User interface may feel data-dense or overwhelming without prior experience in analytics tools.
- Some features and real-time metrics are locked behind higher-tier subscriptions.
Pricing
Santiment offers a tiered pricing structure designed to cater to a range of users, from casual investors to professional traders and analysts.
- The Standard plan is completely free and is ideal for new traders and investors to kickstart crypto analysis.
- For advanced traders and analysts to power decisions with real-time data, Sanbase Pro is available at $49 per month when billed annually.
- At the top of the spectrum is Sanbase Max, priced at $249 per month (billed annually). This plan is suitable for advanced investment strategies with full API access to real-time data.
Best For
Santiment is ideal for data-driven investors, analysts, and institutions who rely on on-chain behavior, developer activity, and whale movements to make informed decisions.
Trading & Technical Analysis Platforms
When it comes to making smart trading decisions, having the right tools can make all the difference. Whether you're drawing trendlines, backtesting strategies, or digging into protocol revenues, these trading and technical analysis platforms give you the edge.
TradingView
TradingView is more than just a charting tool. It’s a complete trading and analysis ecosystem trusted by millions. Whether you're a day trader sketching out strategies, a long-term investor digging into fundamentals, or just someone who loves clean, responsive charts, TradingView gives you the flexibility, speed, and depth to trade with confidence.
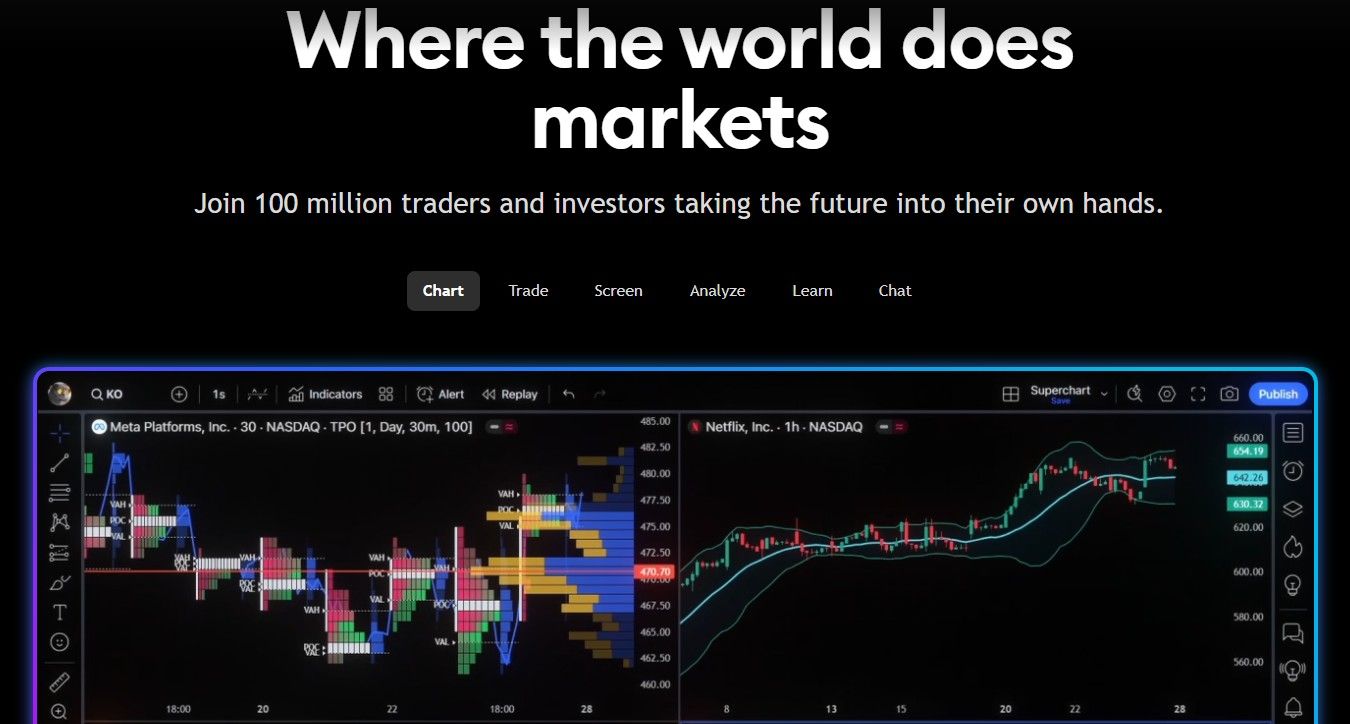 A Trading And Analysis Ecosystem Trusted By Millions. Image via TradingView
Features
- Advanced Charts: Access a wide range of chart types—candlesticks, Renko, Heikin Ashi, and even volume footprint—to visualize market moves with precision.
- 400+ Built-In Indicators: Analyze markets with a massive library of technical indicators, plus over 100,000 community-created scripts.
- Smart Drawing Tools: Use 110+ tools to map out trends, patterns, support/resistance, and Fibonacci levels with ease.
- Multi-Chart Layouts: Track multiple assets simultaneously—up to 16 charts per screen—with synchronized timeframes and drawings.
- Bar Replay: Rewind and simulate past market conditions to study price action and test strategies historically.
- Custom Alerts: Set powerful, cloud-based alerts with 13+ conditions, drawing-based triggers, and Pine Script integration.
- Financial Analysis Tools: Dive into 100+ fundamental metrics, financial statements, valuation data, and global market coverage.
- Pine Script Editor: Create and test your own custom indicators and strategies using an intuitive coding environment with live debugging and autocomplete.
- Strategy Tester: Simulate real-time trading with historical data, track performance, and download reports for in-depth analysis.
- Paper Trading: Practice trading risk-free using virtual funds across stocks, crypto, forex, and more.
- Broker Integration: Trade directly from TradingView’s charts with 80+ verified brokers using secure, low-latency connections.
- Screeners & Heatmaps: Scan global assets based on custom criteria and visualize opportunities using real-time heatmaps.
- Economic & Earnings Calendars: Stay on top of global macro trends, corporate earnings, and dividend dates all from within the platform.
- Mobile, Desktop & Web Access: Sync layouts, watchlists, and settings across devices for seamless trading on the go.
- Social Community: Share trade ideas, scripts, and strategies with a global network of 100M+ traders and investors.
✅ Pros
- Highly customizable and interactive charts with support for dozens of chart types.
- Access to 400+ built-in indicators and over 100,000 community-created scripts.
- Powerful tools like Pine Script, strategy tester, and paper trading support both beginners and pros.
- Cross-platform access via mobile, desktop, and browser with synchronized settings and layouts.
- Seamless integration with 80+ brokers enables trading directly from charts.
- Comprehensive suite of screeners, heatmaps, calendars, and financial metrics.
- Bar Replay and multi-chart layouts make backtesting and real-time analysis effortless.
- Active social community fosters sharing of strategies, indicators, and trade setups.
❌ Cons
- Advanced features like Pine Script alerts and full backtesting are only available in higher-tier plans.
- Premium pricing may be steep for casual or beginner traders.
- Limited access to real-time data for certain markets without additional paid data feeds.
- Some features like watchlist alerts are only available in the most expensive plan.
Pricing
TradingView offers three subscription tiers. Users can choose between monthly or annual billing, with the latter offering a 16% discount, effectively giving two months free. All plans come with a 30-day free trial option.
- Essential – $13.99/month or $167.88/year: Great for beginners, this plan includes 2 charts per tab, 5 indicators per chart, 10,000 historical bars, and 20 alerts each for price and technical indicators. It also offers volume profile, custom timeframes, advanced chart types, second-based alerts, and first-priority support. No ads and no watchlist alerts.
- Plus – $28.29/month or $339.48/year: Ideal for intermediate traders, Plus bumps it up to 4 charts per tab, 10 indicators per chart, 20 parallel connections, and 100 alerts each. Includes everything in Essential, with continued support for advanced charts, formulas, and second/tick-based data. Still no watchlist alerts.
- Premium – $56.49/month or $677.88/year: Built for pros, Premium offers 8 charts per tab, 25 indicators per chart, 20,000 bars, 50 connections, and 400 alerts each. Adds 2 watchlist alerts and full access to all TradingView features—auto patterns, Pine Script, deep backtesting, and pro-level analysis tools.
Best For
TradingView is ideal for traders and investors who want powerful, flexible charting, real-time alerts, strategy testing, and direct broker integration—all in one sleek, cross-device platform.
Token Terminal
Token Terminal is what happens when Wall Street meets Web3. It's a full-stack blockchain data platform that brings real financial metrics, like revenue, fees, and active users, to the world of crypto. Instead of bouncing between a dozen dashboards or manually scraping contract data, you get standardized metrics across all major blockchains and dApps in one place.
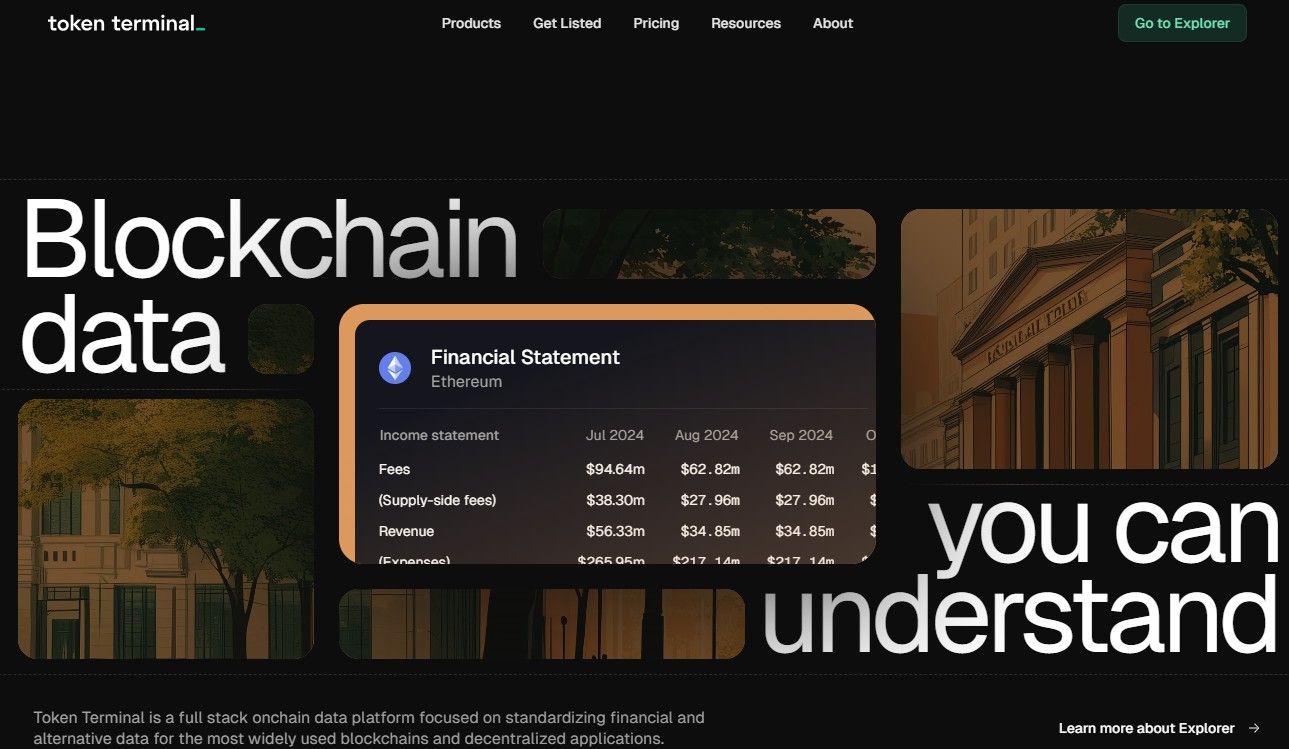 Token Terminal Is A Full-Stack Blockchain Data Platform. Image via Token Terminal
Features
- Standardized Financial Metrics: Track revenue, expenses, fees, and other core financial data across dozens of chains and hundreds of protocols. No guesswork, just numbers you can actually work with.
- Multi-Chain Coverage: Supports data across major networks like Ethereum, Solana, Tron, Arbitrum, Optimism, Base, and many more, so you get the full picture, not just Ethereum stats.
- Entity-Level Analytics: From DApps and protocols to DAOs and chains, Token Terminal lets you drill into specific entities and compare their financial performance side by side.
- Visual Dashboards: Intuitive dashboards that feel like a traditional finance terminal, showing real-time KPIs like active users, trading volume, and stablecoin flows.
- Tools for Every User: Use the Explorer if you want simple charts and summaries. Dive into Sheets if you're a spreadsheet power user. Tap the API or Data Room for deep integration and raw access.
- Institution-Grade Data Quality: Used by top firms like Pantera, VanEck, Bitwise, and even available on the Bloomberg Terminal. If it’s good enough for them, it’s probably good enough for you.
- Weekly Updates + Transparent Methodology: Get consistent updates and clearly documented KPIs—no black boxes or mystery metrics.
✅ Pros
- Standardizes crypto financial metrics like revenue, fees, and expenses across chains and dApps.
- Multi-chain coverage includes Ethereum, Solana, Arbitrum, Optimism, and other top networks.
- Entity-level analysis lets users compare DAOs, dApps, and blockchains side by side.
- Dashboards are clean, intuitive, and modeled after traditional finance terminals.
- Used and trusted by top-tier institutions like Pantera, Bitwise, and Bloomberg.
- Includes tools for different user types—Explorer for summaries, Sheets for analysts, API for developers.
- Transparent methodology and weekly data updates help ensure data credibility and consistency.
- Free tier gives access to historical blockchain data without requiring payment.
❌ Cons
- Pro and API plans are expensive compared to retail-focused platforms.
- Interface and terminology may be intimidating for beginners or casual users.
- Custom Data Room plan lacks transparent pricing and may be cost-prohibitive for smaller teams.
- Focus is mostly on financial metrics, with limited sentiment or technical charting tools.
Pricing
You can access full historical blockchain data with a free account. If you need more advanced features, like downloading data, using Sheets, building custom dashboards, or integrating with the API, you’ll want to upgrade.
- Pro – $292/year (normally $350): Built for professional investors and teams, the Pro plan unlocks unlimited dashboards, full historical data, Sheets and Excel access, CSV downloads, and team collaboration tools. You can start with a 7-day free trial.
- API – $834/year (normally $999): Designed for developers and builders, this plan includes everything in Pro, plus access to REST APIs for blockchain metrics and project data, SDKs in multiple programming languages, 1,000 API requests per day, and a public API uptime status page.
- Data Room – Custom Pricing: Meant for institutional teams and platforms that need raw blockchain data access. It includes data sharing via BigQuery and Snowflake, along with dedicated support and a service-level agreement (SLA). Pricing is customized based on your specific needs.
Best For
Token Terminal is ideal for analysts, investors, and developers who want standardized, finance-grade blockchain data to evaluate crypto protocols with the same rigor as traditional assets.
Portfolio Trackers with Research Capabilities
Managing a crypto portfolio isn’t just about tracking balances, it’s about understanding what you hold and why. These portfolio trackers go beyond surface-level data, offering built-in research tools to help you analyze DeFi exposure, monitor token performance, and uncover new yield opportunities.
DeBank
DeBank is your social dashboard for Web3. Whether you're tracking whale wallets or managing your own crypto portfolio, DeBank gives you the tools to stay plugged into the decentralized world. It’s part wallet tracker, part social network, and part XP-earning playground.
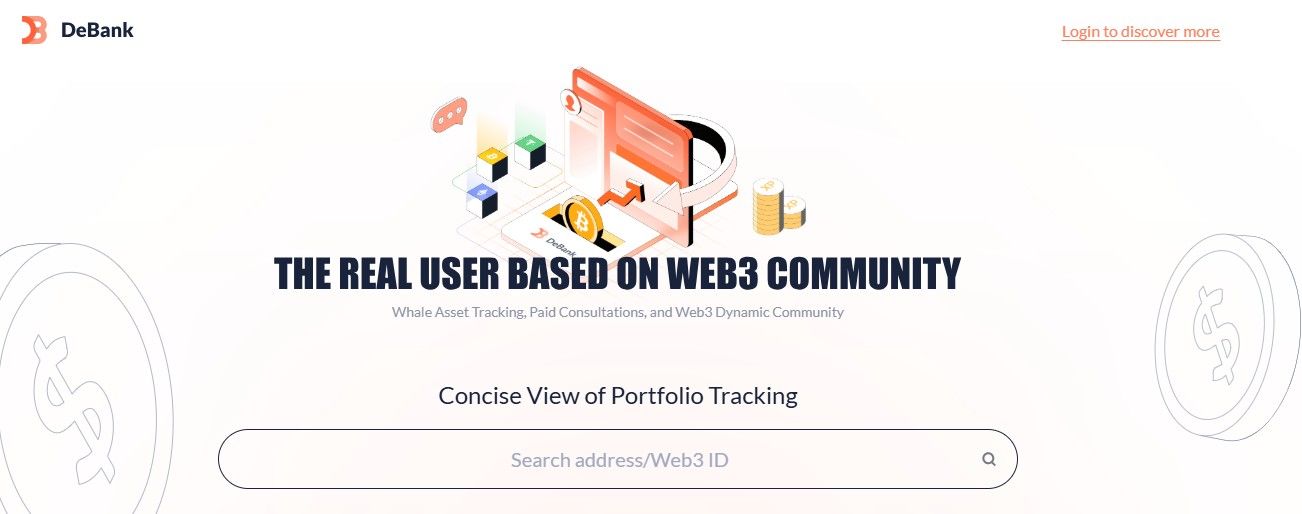 Your Social Dashboard For Web3. Image via DeBank
Features
- Whale Wallet Tracking: Search any wallet or Web3 ID to explore holdings, portfolio changes, and transactions of top crypto players.
- Portfolio Views: Switch between real-time, 24-hour, and summary views to monitor asset changes over time.
- Time Machine: Compare wallet values across any two dates for historical insight.
- Transaction History Mode: Analyze past trades and filter data to see exactly what went down and when.
- Web3 Social Community: Follow users, post content, join discussions, and discover trending voices in crypto.
- DeBank XP: Earn XP by referring friends, completing quests, and staying active on-chain—redeemable for future rewards.
- Credit System: Prove your authenticity and activity level through an on-chain credit score.
- Web3 Badges: Mint badges that showcase your unique achievements across the crypto space.
- VIP Features: Upgrade to follow more users and official accounts, set custom avatars, and unlock more analytics tools.
- Mobile App: Stay connected to DeBank’s full suite of features from anywhere with the official app.
✅ Pros
- Combines wallet tracking, portfolio analytics, and social engagement into one unified dashboard.
- Whale wallet tracking provides unique insights into high-value crypto movements and activity.
- Features like Time Machine and Transaction History enable deep portfolio retrospectives and forensic analysis.
- Web3 social features let users follow, post, and engage with other crypto participants in a decentralized setting.
- XP system and badges gamify on-chain activity and incentivize engagement.
- Flexible pricing lets users pick only the features they need—or unlock everything for a reasonable $15/month.
- Mobile app brings full functionality to users on the go.
- On-chain credit system and customizable profiles add transparency and personalization to the social layer.
❌ Cons
- Most advanced features require individual or bundled payments, which can add up for power users.
- Platform leans heavily on gamification, which may not appeal to all investors or professionals.
- Limited advanced financial analytics compared to specialized data platforms like Token Terminal or Santiment.
- Relies on wallet linking and on-chain activity, which may raise privacy concerns for some users.
Pricing
DeBank now offers a range of a la carte features, priced individually between $3 and $5 per month (courtesy BitDegree). These include:
- Time Machine: View and compare portfolio changes between two dates – $5/month
- Transaction History Analysis: Detailed breakdowns of wallet activity – $5/month
- Following More Users: Expand your follow limit to 3,000 users – $5/month
- "Change View": Track 24-hour changes for any address – $3/month
- "Summary View": View historical asset changes at a glance – $3/month
- Non-NFT Avatar: Upload a custom profile picture – $3/month
- Cover Picture: Personalize your profile page banner – $3/month
- Following More Official Accounts: Increase follow cap for verified accounts – $3/month
Users seeking full access can opt for the bulk subscription at $15 per month, which unlocks all premium features and adds a VIP label to their profile. Importantly, DeBank has stated that as more features are added in the future, existing subscribers will retain access without additional charges.
Best For
DeBank is ideal for DeFi users who want a blend of portfolio tracking, social interaction, and wallet intelligence.
Zapper
Zapper is a powerful crypto app with enterprise-grade on-chain data — portfolio insights, token analytics, DeFi, NFTs, transactions, and more — all delivered in a human-readable format. It supports 50+ blockchains.
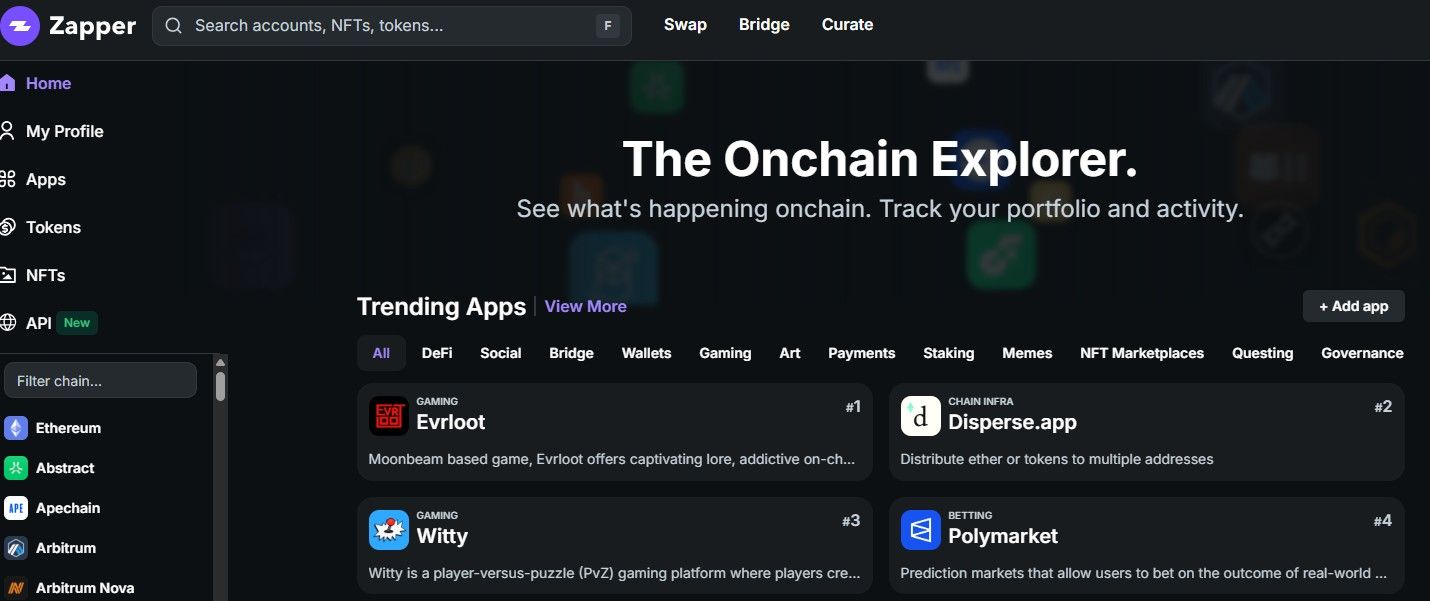 Zapper Is A Powerful Crypto App With Enterprise-Grade On-Chain Data. Image via Zapper
Features
- Cross-Chain Coverage: Access portfolio, price, and transaction data across 50+ blockchains in just a few lines of code.
- Human-Readable Activity Feeds: Easily interpret on-chain actions with structured, intuitive data formats.
- Real-Time & Historical Token Prices: Get accurate pricing data for any token, including long-term trends.
- Unified DeFi & NFT Analytics: Monitor user activity and asset performance across DeFi protocols and NFT platforms.
- Farcaster & Search Support: Leverage additional contextual data with built-in support for Farcaster and wallet search.
- Developer-Ready: Skip the heavy lifting of indexing and parsing — use ready-to-integrate endpoints optimized for speed.
- Battle-Tested Infrastructure: Built on a foundation powering consumer crypto apps for over 5 years — stable, scalable, and reliable.
Best For
Zapper is ideal for data-driven investors, developers, and analysts who need comprehensive, cross-chain portfolio insights with clean, human-readable formats.
How To Choose The Right Tool Stack?
Choosing the right research tools depends heavily on your goals and how you engage with the market.
Traders may prioritize real-time sentiment trackers and technical analysis (TA) platforms, while long-term investors might lean on on-chain metrics and project fundamentals. NFT collectors, on the other hand, need tools that monitor community sentiment, rarity scores, and trading volumes specific to NFT platforms.
No matter your profile, cross-verifying insights is crucial. Relying on a single data source can leave blind spots—what looks bullish on social media might be contradicted by on-chain flows or technical indicators. That’s why the smartest approach combines multiple perspectives.
To gain a 360° market view, blend sentiment analysis (for gauging hype and community energy), on-chain analytics (to track real user activity and token movements), and technical analysis (for timing trades and managing risk). This layered strategy increases confidence in your decisions and helps you avoid getting swayed by surface-level signals.
Closing Thoughts
At the end of the day, no single tool has it all. The key is building a stack that fits your style.
Maybe that’s combining Glassnode’s on-chain precision with LunarCrush’s social pulse, or pairing TradingView’s charts with Santiment’s behavioral insights. What matters most is using a mix of data points to verify your thesis, spot opportunities early, and dodge the hype traps.
With the right setup, you’ll have a clear edge in a space where information moves as fast as the markets themselves.


