GM anon!
Let’s face it, it is hard not to fall for the latest shiny coin in crypto. With the amount of FOMO going on in crypto, why wouldn’t you get tempted to dump $1,000 of your hard-earned money into the latest memecoin, blindly hoping for a 100X?
A more reliable approach to evaluating potential investments lies in understanding market capitalization and fully diluted value. These metrics provide crucial insights into a coin's valuation and can serve as a better foundation for making informed decisions.
Market cap (MC) and fully diluted value (FDV) are fundamental indicators of a crypto’s value. They help investors gauge a coin's size and potential growth.
Let’s start with the core definitions:
- Market Cap (MC): The total value of all mined coins. It's calculated by multiplying the number of coins in circulation by the current market price of a single coin.
- Fully Diluted Valuation (FDV): Represents the total value of a project by multiplying the current token price by the total number of tokens, both circulating and future.
Analyzing FDV: MC Ratio
Analyzing FDV is crucial in crypto investments, especially when comparing it to market capitalization. A high FDV: MC ratio indicates that a large number of tokens are yet to hit circulation, which can significantly dilute the value of existing holdings.
For instance, a 200:1 FDV: MC ratio means that, once all tokens are unlocked, the market would require enormous buying pressure to maintain the current price. If the buying pressure remains constant, the price could drop drastically.
For example, Serum once had a 200 FDV: MC ratio, with a $30.3B FDV and a $151.6M MC. Such a high ratio means that, upon token unlock, the price could be severely impacted unless there is a significant increase in demand. This is compounded by venture capitalists selling off their stakes, further increasing sell pressure.
Investors have become wary of low float, high FDV projects, preferring coins with a 1:1 MC/FDV ratio, like memecoins such as PEPE. These coins can see short-term price increases, but without widespread adoption and sustained new buying interest, their prices tend to decline in the long term. Thus, a careful analysis of FDV relative to MC is essential for making informed investment decisions.
Analysis via Market Cap Levels
Market capitalization (market cap) levels can provide valuable insight into the potential and stability of coins. Here's a quick guide:
| Market Cap Level | Characteristic | Strategy |
| Sub $100k | Extremely high risk, low liquidity, often new or obscure projects. | Avoid or approach with extreme caution. These coins can pump quickly but are prone to rapid declines and scams |
| $100k-$1M | Early-stage projects, some community presence, moderate liquidity | Invest small amounts. These projects can offer high rewards but are still very risky. Look for strong community support and active development. |
| $1M-$10M | Growing projects, increasing community and developer activity, improving liquidity | Consider moderate investments. These projects are gaining traction and have potential for significant growth. Research thoroughly to ensure the project has long-term viability. |
| $10M-$50M | More established, substantial community and liquidity, more media coverage. | Invest with more confidence. These projects have shown resilience and growth potential. Monitor for consistent development and community engagement. |
| $50M-$100M | Well- established, significant liquidity, strong community, and media presence | These projects are relatively stable and have demonstrated success. This is the crucial “mid cap” zone. If coins break through this level, the upside could be high. However, keep in mind that very few coins experience a proper breakout. |
| $100M-$500M | Major players in the space, significant market presence, high liquidity. | These are safer bets wit ha good balance of growth potential and stability. Ideal for more conservative investors looking for lower risk. |
| $500M-$1B | Leading projects in the crypto space, very high liquidity, widespread adoption. | These are among the safest meme coin investments. Expect moderate growth and relative stability. Suitable for larger, more conservative investment portfolios. |
| $1B-$10B | Dominant projects, significant influence on the market, very high liquidity and stability. | Investments in this range are generally very safe, with steady but slower growth potential. Ideal for long-term holding and conservative investment strategies. |
| $10B-$20B | Top-tier projects with major market influence and extremely high liquidity. | These projects are very stable and have proven success. Suitable for large, conservative investments. |
Rule of thumb:
Lower market caps offer higher risk and reward opportunities, while higher market caps provide stability and lower growth potential. By understanding these levels and employing appropriate strategies, investors can make informed decisions that align with their risk tolerance and investment goals.
Most coins tend to fade away quickly, but identifying a hyped coin when its market cap is around $100M can present a lucrative opportunity, as it has the potential to surge to $1B. For instance:
- Investing in a coin with a market cap of $1M and holding it until it reaches $100M translates to a remarkable 100x return.
- Similarly, spotting a coin at $200M and riding its growth to $1B results in a 5x gain.
- Even investing in a coin at $1B and holding it until it reaches $10B can deliver a substantial 10x return.
The “Sweet Spot”
If you are looking for moonshots, you may want to look around the mid-cap region of $50M to $100M. In this zone, the coin has established itself enough to get a higher 8-figure market cap, but there is still significant upward potential. The coins are still priced relatively well, so you can get in a decent position.
Coin Analysis
Alright, let’s analyze some coins.
Analyzing Toncoin
Let’s examine Toncoin (TON) 's performance and what we can expect from its future growth.
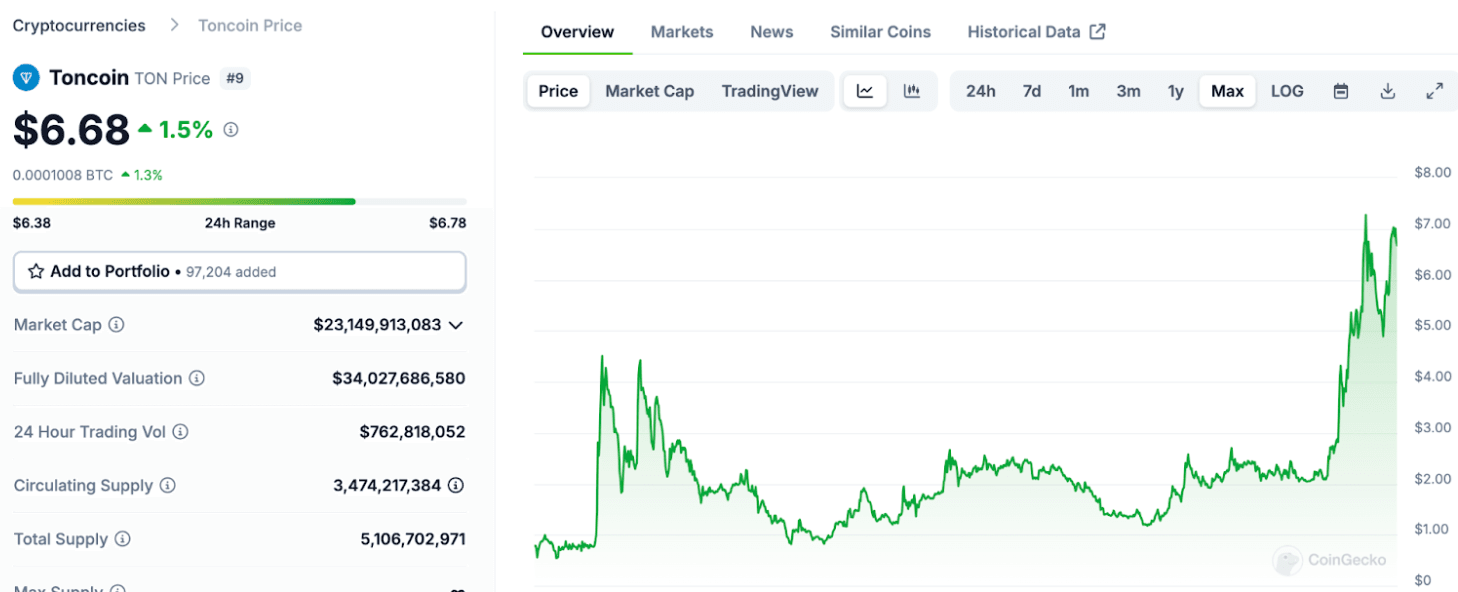 Image via CoinGecko
The chain is currently gaining a lot of hype, and we recently covered the project. Let’s compare TON to Solana.
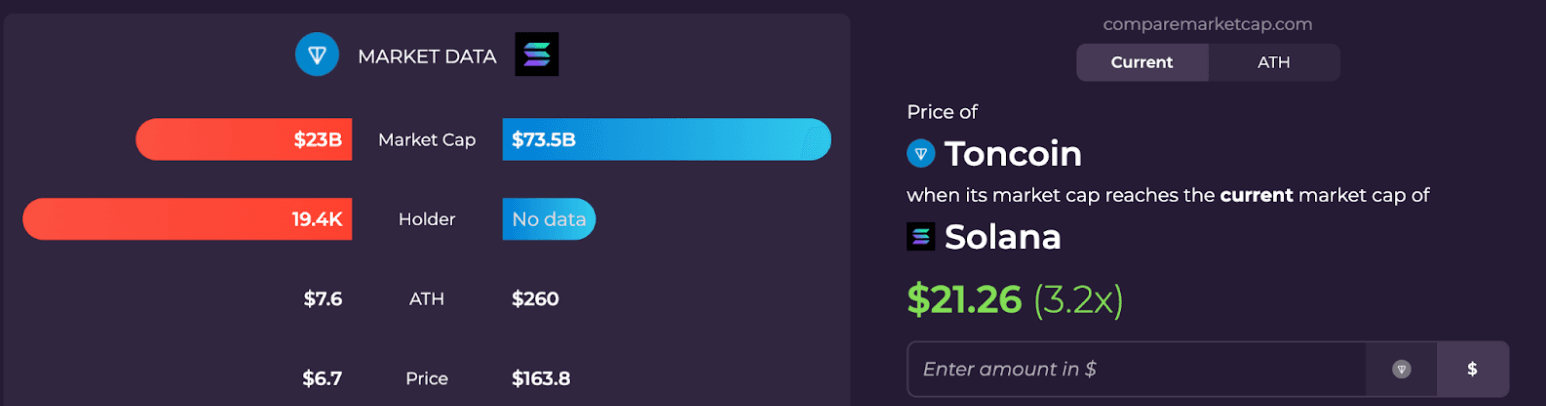 Source
Currently, TON would need to 3x from here to reach where Solana is now. The FDV: MC ratio for TON isn't bad and is around 1.47. So, there is good growth potential here, but can it reach Solana levels?
For that, we will need to look at chain utility.
Here is a DeFi TVL comparison of both Toncoin and Solana.
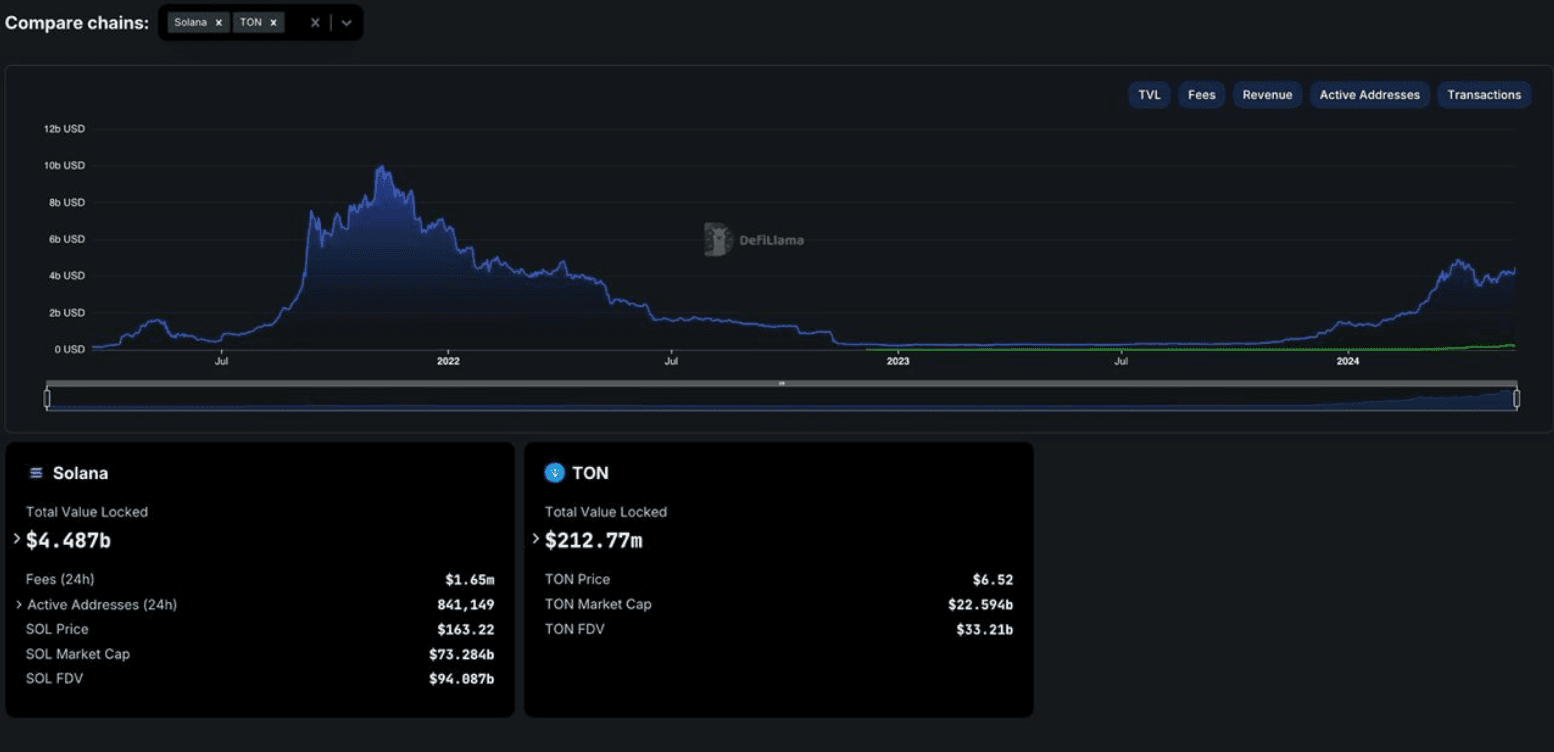 Source: DeFiLlama
TON currently has a mere fraction of Solana’s TVL. Of course, this number can and will grow, but will it reach Solana’s level? Is that educated optimism or pure hopium? At least the FDV: MC ratio suggests that the supply won’t go out of control.
Even if TON reaches the $10 psychological level, its market cap would be around $35B. To surpass $50B, TON would require substantial utility and significant DeFi development.
Analyzing SAFE
SAFE has impressed us over the last few weeks due to the smart money action it has received post-unlock.
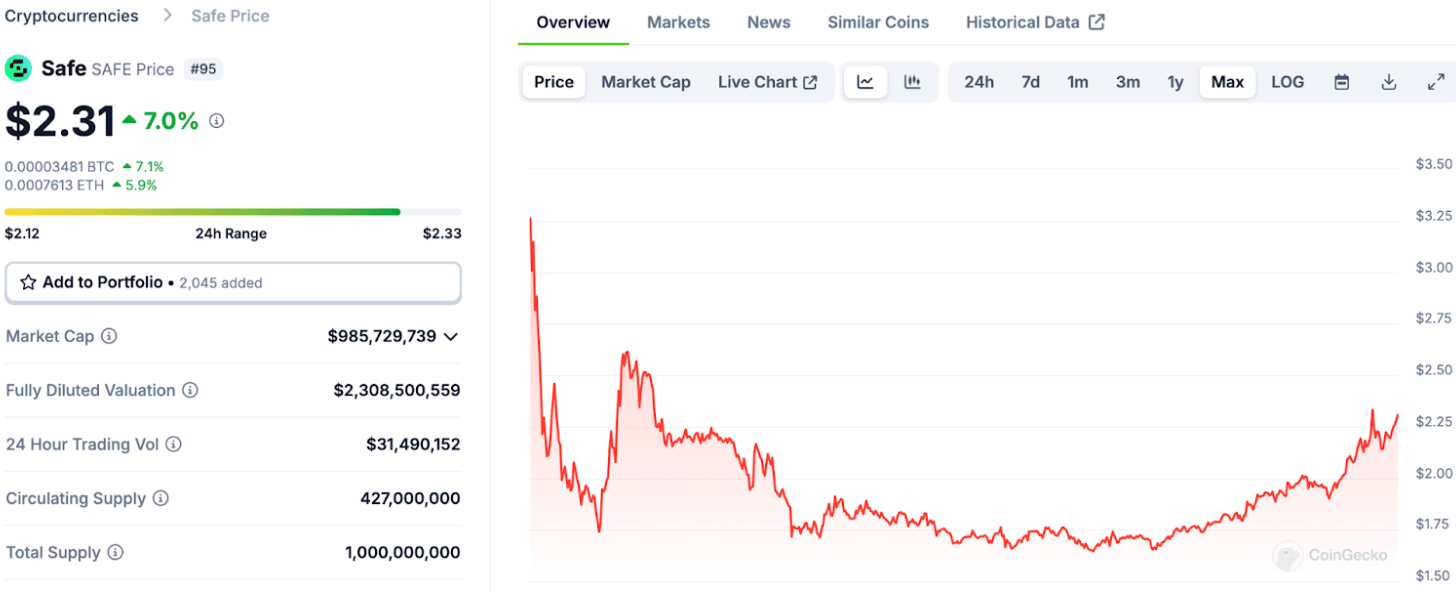 Image via CoinGecko
The current MC is around $985M and the FDV is around $2.3B. The FDV: MC ratio is around 2.325. That’s not necessarily ideal, but it is still not out of control. We know from smart money analysis that the number of smart money addresses holding SAFE has jumped significantly.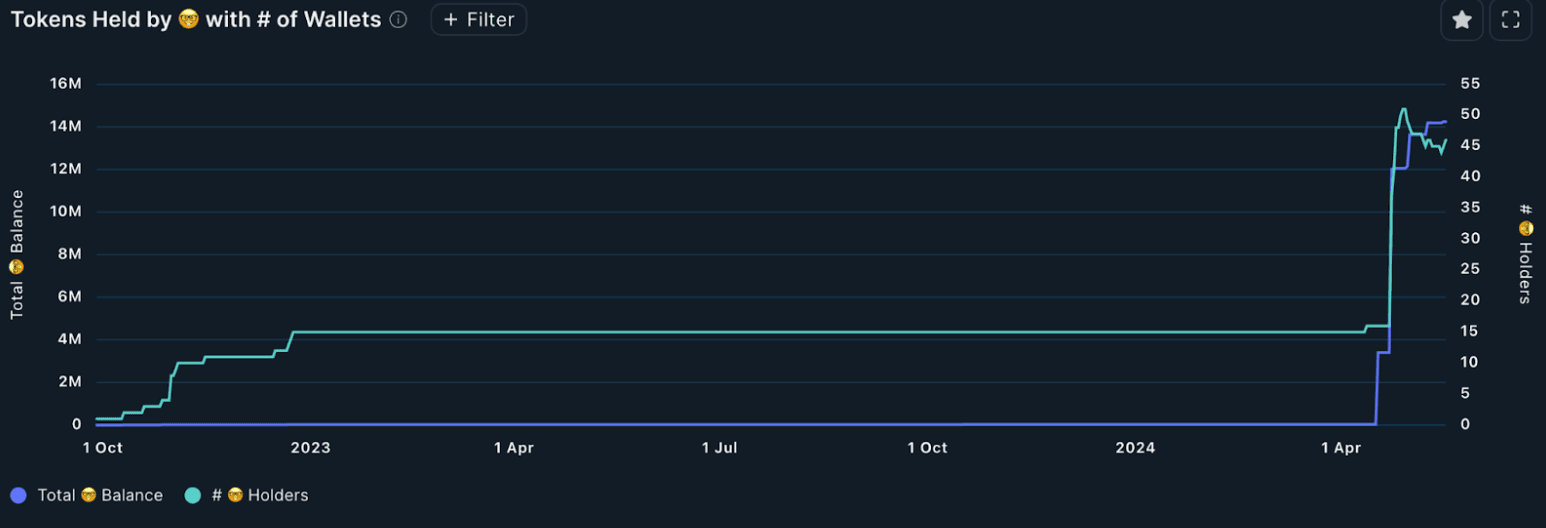
The market cap is still sub-$1B, so there is definitely good upward potential. Plus, SAFE is 35% down from its all-time high, which was reached a little less than a month ago. We feel that the realistic market cap level for the coin is around $3B–$5B, assuming SAFE tokens garner enough demand to break past the $3 resistance barrier.
Analyzing Smart Money Mid-Caps
Let’s use the methods we have learned in this newsletter and the last few newsletters to analyze a mid-cap coin. We are going to use Nansen’s smart money tools to see what mid-cap coins these addresses have been trading over the last 7 days. If you want to learn how to Nansen, then checkout our smart money newsletters.
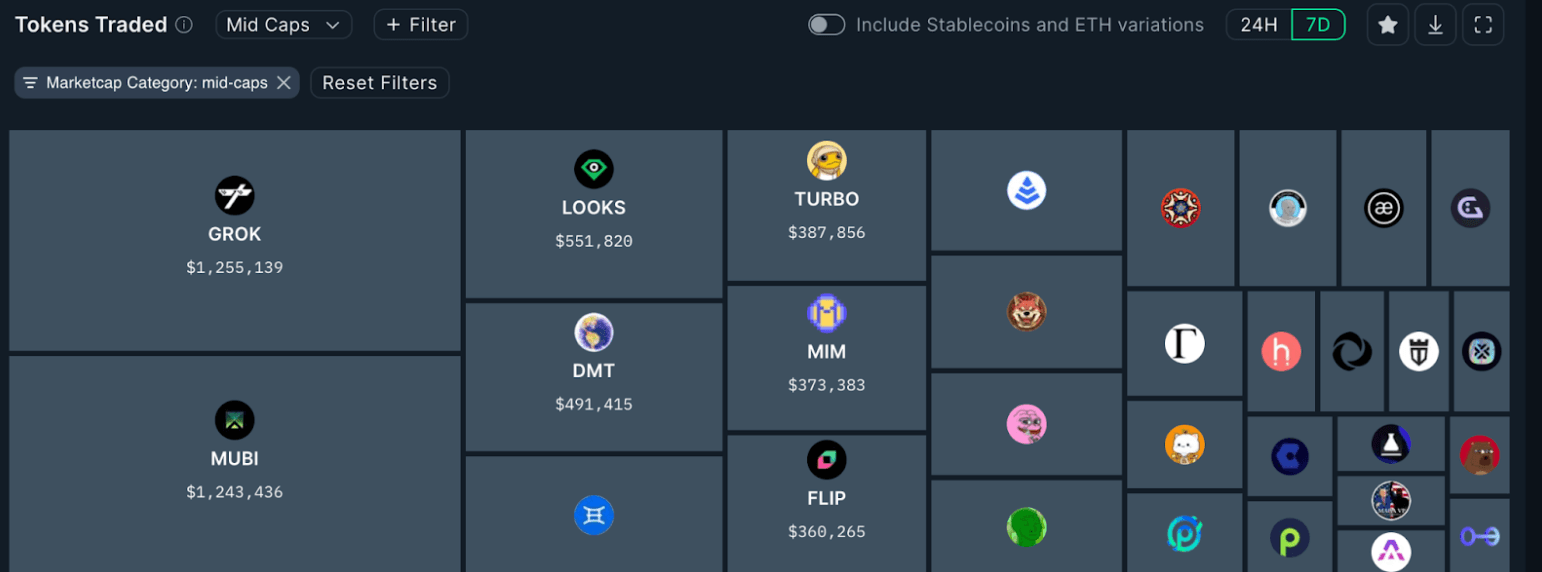
Let’s look at the coins that have attracted at least a million dollars:
- GROK
- MUBI
Now, let’s do the marketcap analysis.
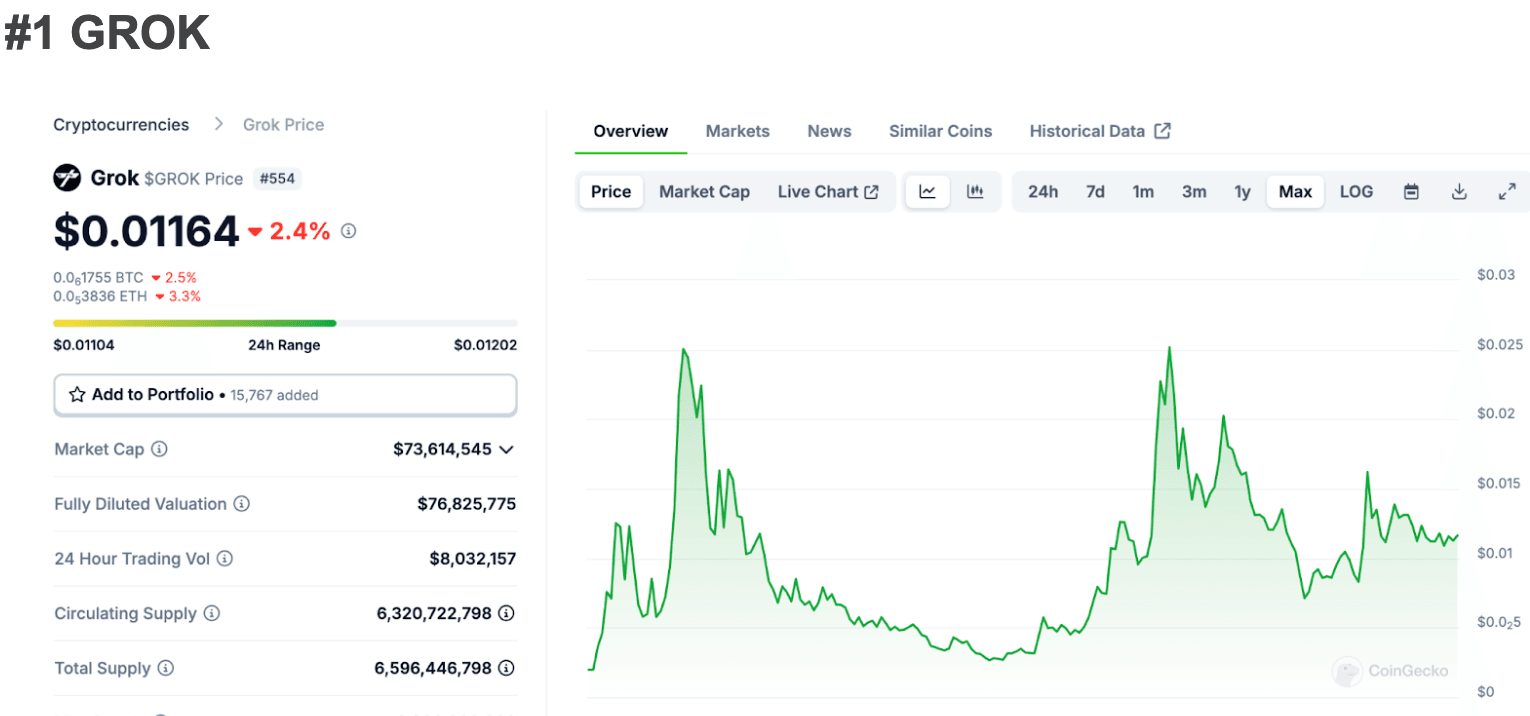 Image via CoinGecko
-FDV:MC ration: 1:04
Let's start with GROK, the leading mid-cap coin heavily traded by smart money addresses. Examining the FDV: MC ratio reveals why our thesis holds true: investors favor memecoins due to their favorable FDV: MC ratios.
This metric underscores the appeal of GROK and similar assets, reflecting the strategic preferences of savvy investors. GROK is currently trading ~60% below its ATH, so upwards growth potential is definitely there.
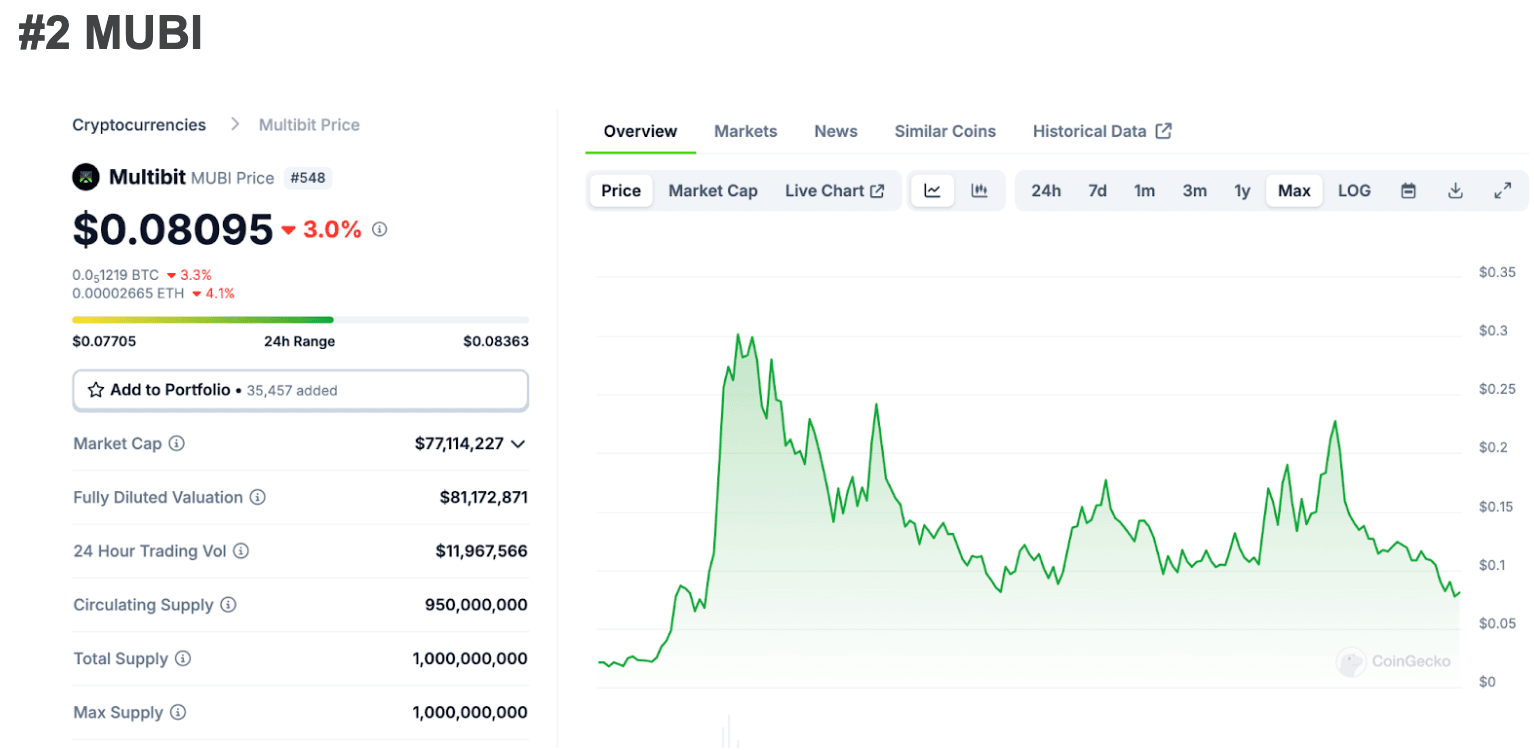 Image Source: CoinGecko
-FDV:MC ration: 1.053
Another one with a near 1:1 FDV:MC ratio. It is interesting to see that MUBI is getting so much love. They are definitely capitalizing on the BRC20 hype. The MultiBit developers are expanding EVM compatibility for their EVM to EVM bridge, now live on Ethereum, BNB Chain, and BounceBit, to support both BRC20 and Rune assets.
They are also onboarding more Rune assets and developing additional farming strategies for BounceBit and BitStable. Is smart money smelling an opportunity here?
That wraps up today's insights!
Enjoyed this article?
- Subscribe to Crypto Pragmatist by M6 Labs newsletter for crypto-native industry insights and research read by 30k+ subscribers
- Follow us on Twitter for Tweets providing top-notch insights and bridging the gap between users, builders, and leaders in the crypto space


