In 2009, the financial world saw the introduction of a new asset class that was decentralized, unregulated, and not controlled by any company or a central bank. Bitcoin took the financial scene by storm, with people trading the asset from being valued at a few dollars to thousands in under a decade.
Investors view Bitcoin from many angles. Some consider it as a store of value and call it digital gold. Other investors are speculative; they don't view it as an asset that preserves wealth but one that is bought and sold through its cycles for a profit, like stocks. Bitcoin and stocks attract significant speculative investment and draw parallels in their volatility and potential for high returns.
Traders analyze the movements of various financial instruments in tandem with one another to gauge market sentiment and predict future trends. They believe certain assets are correlated, and assessing the degree to which two are correlated is a valuable insight into the market.
Bitcoin and stocks share a common trait: they are both speculative assets. Such assets are often traded on price speculation rather than intrinsic value. Given this shared characteristic, some believe that the movement of one speculative asset, such as stocks, can reflect the market's risk appetite, potentially allowing us to predict the future behavior of another speculative asset, like Bitcoin. Investors willing to take on more risk may move funds into speculative assets.

This article aims to assess the validity of this notion: are stocks and Bitcoin correlated? This Bitcoin and stock market correlation piece will comprehensively explain how these two significant financial instruments interact by examining the historical correlation between Bitcoin and the stock market and analyzing how critical macroeconomic factors like inflation and interest rates influence this relationship. This analysis by the Coin Bureau seeks to uncover whether the movements in the stock market can indeed serve as a predictor for Bitcoin's price behavior.
Prerequisite Concepts
The analysis done in this article is thoroughly data-driven. Consequently, the research involves leveraging key statistical analysis concepts that the average reader may not be aware of. I'm dedicating this section to covering such concepts to help you gain an intrinsic understanding of the research. The context of each tool described here will be better understood in the methodology section of the article.
What is Correlation?
Correlation is a statistical measure that describes the degree to which two variables move in relation to each other. Correlation can quantify the relationship between the price movements of different assets. When investors plan portfolio diversification, risk management, or trading strategies, correlation helps guide their decisions with facts and figures.
Statistical Correlation Basics
At its core, correlation indicates whether an increase or decrease in one variable will correspond to an increase or decrease in another variable. The correlation coefficient, typically represented by the symbol r, ranges from -1 to 1 and provides a standardized measure of this relationship:
- +1 indicates a perfect positive correlation, where an increase in one variable always results in an increase in the other.
- -1 indicates a perfect negative correlation, where an increase in one variable always results in a decrease in the other.
- 0 indicates no correlation, meaning that the movements of the variables are completely independent of each other.
Types of Correlation
- Positive Correlation: A positive correlation means that the two variables move in the same direction. When one variable increases, the other also increases; when one decreases, the other does as well. Example: The prices of two tech stocks might be positively correlated because similar market conditions and investor sentiment influence them.
- Negative Correlation: A negative correlation means that the two variables move in opposite directions. When one variable increases, the other decreases, and vice versa. Example: The price of gold and the stock market often correlate negatively. Investors might flock to gold as a safe haven when stock prices fall, driving its price up.
- No Correlation: No correlation indicates that there is no predictable relationship between the movements of the two variables. Changes in one variable do not result in consistent change in the other variable. Example: The price of a tech stock and an agricultural commodity might show no correlation, as different factors influence their movements.
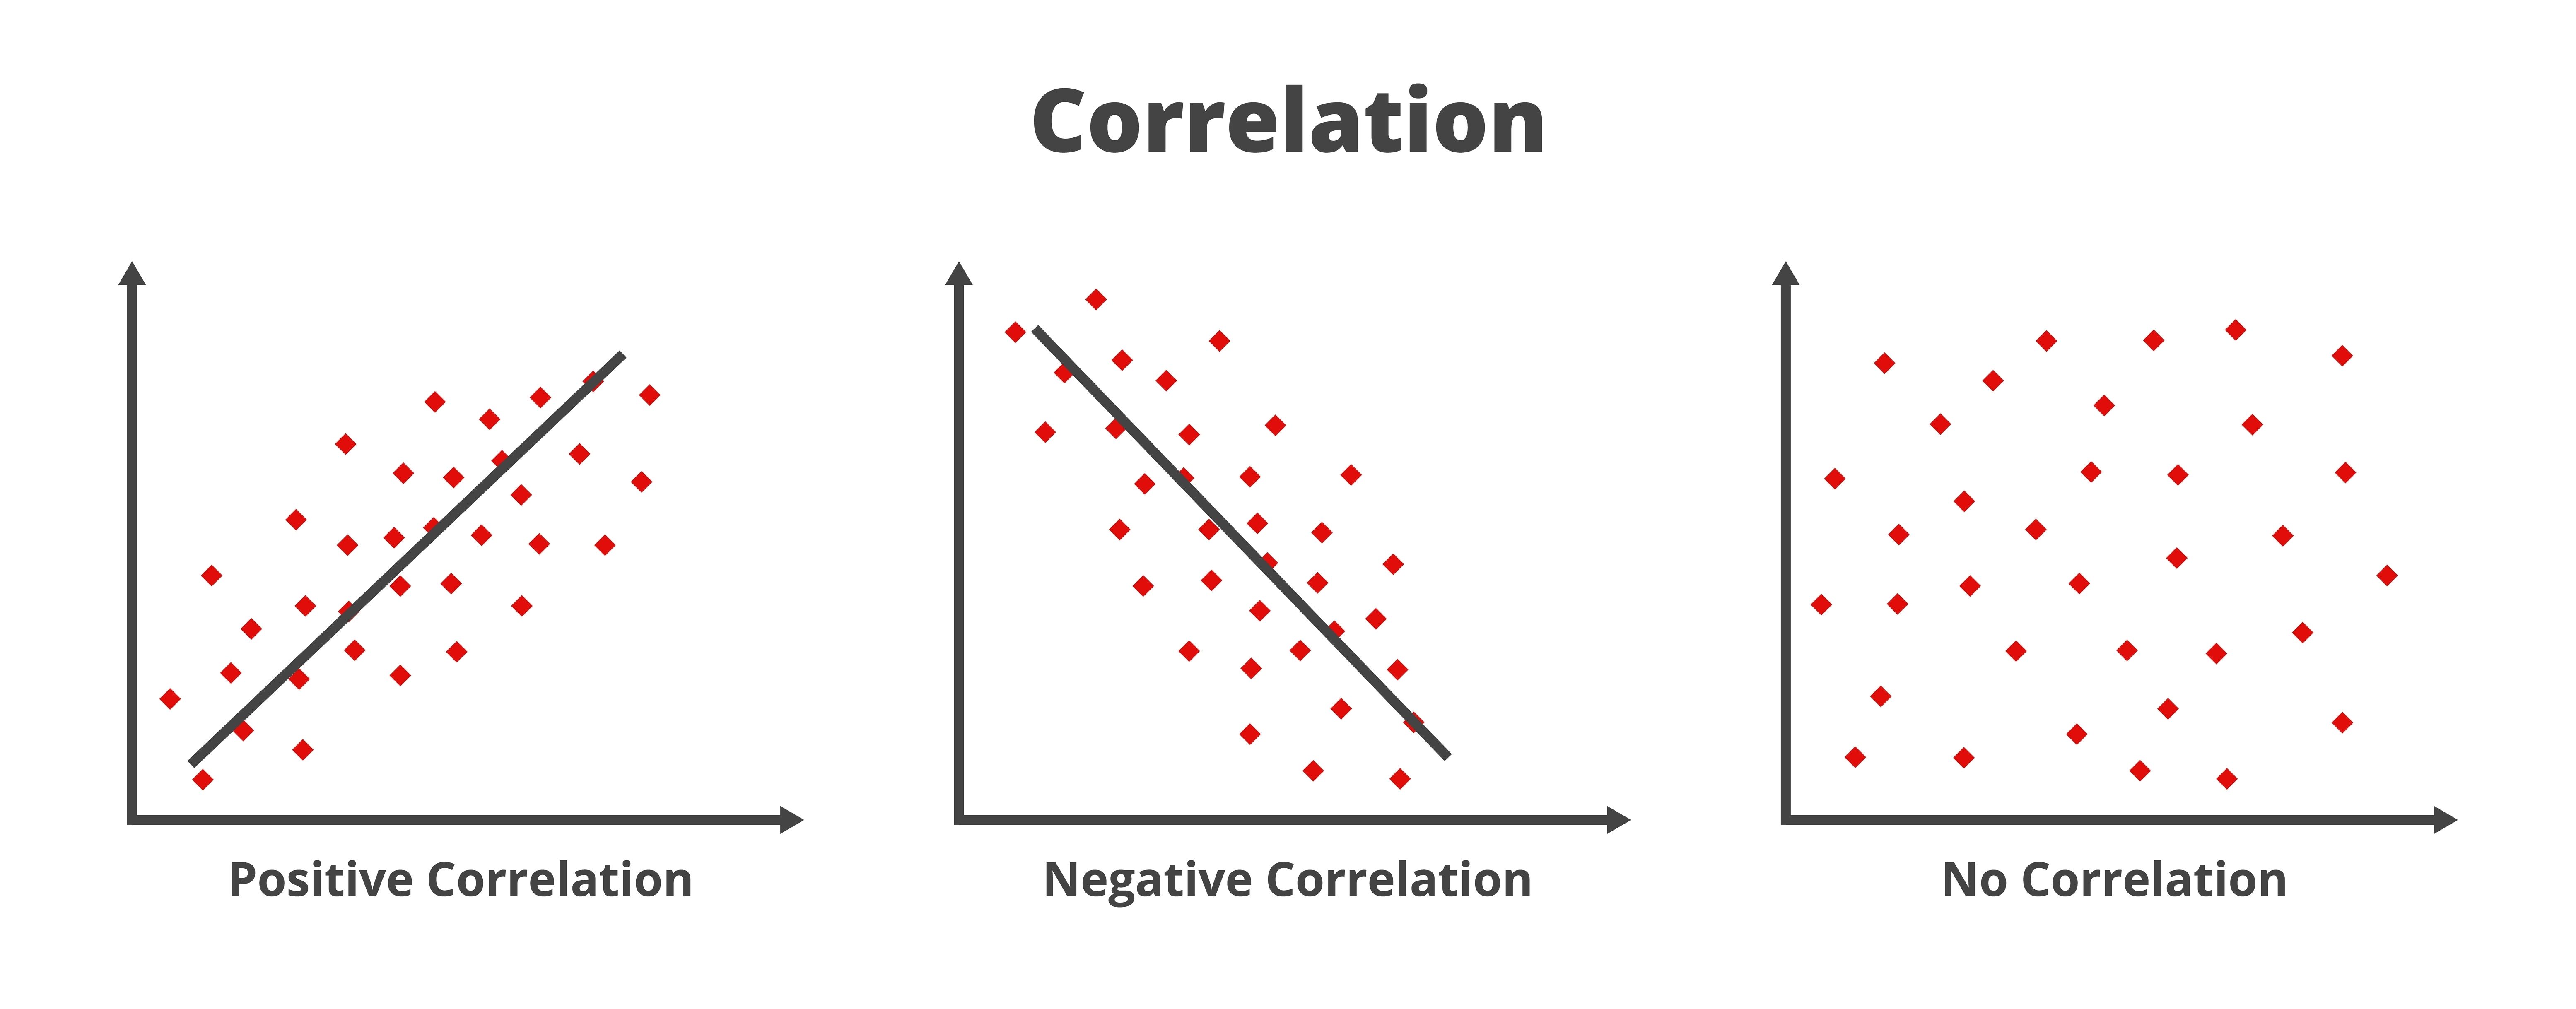 Image via Shutterstock
How Correlation is Measured
The correlation coefficient (r) is the primary measure used to quantify the strength and direction of the relationship between two variables. It is calculated using various statistical methods, but the most common method in financial analysis is the Pearson correlation coefficient.
Pearson Correlation Coefficient: The Pearson correlation coefficient measures the linear relationship between two variables. It is calculated using the formula:
Interpretation:
- r = 1: Perfect positive linear relationship.
- 0 < r < 1: Positive linear relationship, increasing strength as r approaches 1.
- R = 0: No linear relationship.
- -1 < r < 0: Negative linear relationship, with strength increasing as r approaches -1.
- r = -1: Perfect negative linear relationship.
By calculating and interpreting the correlation coefficient, investors and analysts can gain insights into how different assets are likely to move in relation to each other. This information is invaluable for constructing diversified portfolios, anticipating market movements, and understanding the broader financial landscape.
What is Regression?
Regression analysis is a powerful statistical tool for understanding the relationship between a dependent and an independent variable. In our context, we will use regression analysis to find the effect of macroeconomic forces like federal funds rate on dependent variables like BTC and stocks.
Statistical Regression Basics
At its core, regression analysis involves fitting a line or curve to a set of data points to minimize the differences between the observed values and the predicted values. This "best-fit" line describes the relationship between the variables and can be used to make predictions about the dependent variable based on known values of the independent variables.
Simple Linear Regression is the most basic form of regression analysis, involving one dependent and one independent variable. The relationship between the two variables is modeled with a straight line. The equation for simple linear regression is:
Where:
- Y is the dependent variable.
- X is the independent variable.
- β0 is the intercept (the value of Y when X = 0).
- β1 is the slope of the regression line (the change in Y for a one-unit change in X).
- ϵ is the error term (the difference between Y's observed and predicted values).
How Regression is Measured
Regression analysis aims to estimate the coefficients (β) that define the relationship between the independent and dependent variables. It typically uses methods such as least squares estimation, which minimizes the sum of the squared differences between the observed and predicted values.
- Coefficient Estimation:
- The coefficients (β) are estimated such that the sum of the squared residuals (differences between observed and predicted values) is minimized.
- In simple linear regression, the slope (β1) indicates how much the dependent variable (Y) changes for a one-unit change in the independent variable (X).
- Goodness of Fit:
- R-squared: This statistic measures the proportion of the variance in the dependent variable that is predictable from the independent variables. It ranges from 0 to 1, where a higher value indicates a better fit.
- Significance Testing:
- P-value: This statistic tests the null hypothesis that the coefficient (β) equals zero (no effect). A low p-value (< 0.05) indicates that the coefficient is statistically significant.
- T-statistic: This statistic tests whether a coefficient is significantly different from zero. It is calculated as the coefficient divided by its standard error.
Regression analysis provides a detailed understanding of how independent variables influence a dependent variable, allowing us to make predictions and identify critical relationships. In financial markets, it helps investors and analysts understand how various economic factors impact asset prices, informing better decision-making and strategy development.
Methodology and Research Design
This study employs a quantitative research design to examine the relationship between Bitcoin prices and the stock market over the past five years and how interest rates have influenced this relationship during the same period. Two separate indices are used as proxies for the stock market:
- NASDAQ Index: Represents the overall stock market.
- NASDAQ 100 Technology Index (NDXT): Represents the technology sector within the U.S. market.
Data Collection
Data were collected from the following sources:
- Bitcoin Prices: Bitcoin's daily closing prices were obtained from CoinGecko, a reliable and comprehensive cryptocurrency market data provider.
- NASDAQ Index: Daily index values were obtained from Yahoo.com.
- NASDAQ 100 Technology Index (NDXT): Daily index values were obtained from Yahoo.com.
- Federal Fund Rates: Monthly interest rate data were obtained from the U.S. Treasury website.
The study period spans five years, from May 2019 to May 2024, providing a robust dataset for analysis.
Data Processing
Since Bitcoin closing prices are available daily, but NASDAQ and NDXT indices don't trade on weekends and holidays, the NASDAQ and NDXT values were aligned with Bitcoin prices by forward-filling the missing dates with the last available trading day value preceding the date.
Calculating Correlations
BTC and NASDAQ: Pearson correlation coefficients were calculated daily between BTC prices and NASDAQ index values.
Assessing Correlations
Assessing the variation of correlations over time involves a 90-day rolling correlation analysis was conducted.
Regression Analysis
Data Alignment
The daily correlation values were converted to monthly average correlations to align them with the available monthly interest rate values.
- Independent Variable - Interest Rates: Monthly federal funds rate values.
- Dependent Variables - BTC-NASDAQ Correlation: Monthly correlation coefficients between BTC and NASDAQ.
Model Specification
One simple linear regression models were specified:
- BTC-NASDAQ Correlation = β0 + β1⋅Interest Rate + ϵ
Model Estimation
The regression models were estimated using Ordinary Least Squares (OLS) in statistical software such as R or Python.
Evaluation
Goodness of Fit
- R-squared: To determine how well the independent variable explains the variability in the dependent variables.
- Adjusted R-squared: To adjust for the number of predictors in the model.
Statistical Significance
- p-values: To test the significance of the regression coefficients.
- Confidence Intervals: To provide a range within which the true regression coefficients are expected to lie.
Interpretation
The regression results were interpreted to understand the relationship between BTC-NASDAQ (stocks) and macroeconomic factors like interest rates. The significance and direction of the coefficients provided insights into how changes in interest rates influence the correlations.
Correlation Analysis Results and Discussion
We have explained the data collection and processing steps in the methodology section. We first collected the BTC price data and imported it into an Excel spreadsheet. The next steps involved fetching NASDAQ and NDXT indices data and aligning them with BTC price data in the same sheet. With forward fill, the data missing data relating to weekends, holidays, and days when the market was closed were included in the data set.
Correlation analysis involves using the built-in functions in Excel. You can the Google spreadsheet (Sheet 3) to access data sets.
The chart depicts the 90-day rolling correlation between Bitcoin (BTC) and two stock indices: NASDAQ (general market) and NDXT (tech sector). The blue line represents the BTC-NASDAQ correlation, while the orange line represents the BTC-NDXT correlation. We can make key observations based on these results:
Fluctuating Correlations
Both correlations fluctuate over time, indicating periods of varying relationship strength between BTC and the stock indices. Significant fluctuations suggest that this relationship is unstable and may be influenced by many factors.
Periods of Positive and Negative Correlation
There are periods where both correlations are positive, suggesting that BTC and the stock indices move in the same direction during those times. A notable period of positive correlation occurs from late 2021 to early 2022, potentially reflecting similar market sentiments driving both BTC and stocks. The correlation was largely negative from 2020 to mid-2021, indicating that stocks and Bitcoin moved in opposite directions.
Comparing BTC-NASDAQ and BTC-NDXT Correlations
While both the correlations overlap often, BTC-NDXT appears to have more pronounced fluctuations than BTC-NASDAQ, suggesting a potentially stronger relationship with the tech sector. The BTC-NDXT correlation often shows sharper peaks and troughs, indicating that BTC may be more sensitive to tech stock movements than the broader market.
Recent Trends
Both correlations have shown an upward trend in recent months, particularly since April 2024, indicating increasing alignment between BTC and the stock indices. The increasing correlation could be a reflection of the broader economic recovery and increased risk appetite among investors.
Analyzing Correlation in the Context of Major World Events
The 90-day rolling correlation between Bitcoin (BTC) and the NASDAQ and NDXT indices reflects how these relationships have evolved over time. Various world events, market dynamics, and economic policies influence the correlations. We link these fluctuations with significant global events to provide deeper insights into the observed patterns.
COVID-19 Pandemic (Early 2020 – Ongoing)
The onset of the COVID-19 pandemic in early 2020 led to unprecedented market volatility as global economies grappled with lockdowns, supply chain disruptions and uncertainty. Here are some observations:
- A sharp correlation decline in early 2020 is observed as markets initially reacted to the pandemic.
- Recovery and subsequent increase in correlations during mid-2020.
Digital assets were not as liquid as they are these days, so they reacted more sharply to COVID than stocks did. The negative correlation confirms this narrative. As governments and central banks introduced stimulus measures, markets responded with increasing risk appetite, gradually incrementing the correlation near zero. A near-zero correlation in the late 2020s may indicate that two separate classes of investors owned stocks and Bitcoin, resulting in independent market behavior.
Bitcoin Halvings (May 2020 and April 2024)
Bitcoin halvings reduce the reward for mining new blocks, effectively halving the rate at which new bitcoins are generated, which can have significant market implications. Since halvings reduce the supply rate of Bitcoin by half, they are generally considered a favorable event by investors, leading to substantial volatility in the months around halving.
An interesting pattern is observable in the two halvings recorded in the chart. There is a sharp uptick in correlation within two months after the halving event. Halving events generate new demand for Bitcoin. The uptick after 2020 halving is very sharp because digital assets fell to COVID considerably in that time. While the uptick is also evident in the latest halving, the effect is much less pronounced, which may be explained by BTC trading near ATH levels in these months.
Federal Reserve Quantitative Tightening (June 2022 – July 2023)
Quantitative tightening (QT) refers to reducing the Federal Reserve's balance sheet by selling government bonds and other securities, effectively reducing liquidity in the market.
The correlation between June 2022 to July 2023 was quite erratic. The initial rise can be attributed to reducing liquidity in the market and increasing risk aversion as treasury bonds became more lucrative with rising rates against risk assets.
Another observable pattern is the BTC-NASDAQ (blue) correlation, which makes higher peaks and lower troughs than BTC-NDXT, which means Bitcoin behaved more similarly to NDXT than NASDAQ. Investors who buy tech stocks are more likely to own other riskier assets, and some investors also view Bitcoin as they view tech stocks. These reasons can explain the diversion of correlations in the QT period.
 Image via ChatGPT
Luna Market Crash
The Terra (LUNA) ecosystem collapse occurred in May 2022, causing one of the most significant market crashes in the cryptocurrency space. The crash was triggered by the de-pegging of TerraUSD (UST), an algorithmic stablecoin, which led to a massive sell-off in LUNA and other cryptocurrencies.
The correlations sat around zero in the weeks leading to the crash, after which we can observe a decline in both BTC-NASDAQ and BTC-NDXT correlations. This period was marked by increased volatility in the cryptocurrency market, leading to a decoupling effect.
Here's a statistical explanation:
- Volatility Shock: The sudden and severe volatility caused by the Luna crash disrupted the usual trading patterns, leading to a temporary correlation breakdown.
- Outliers and Anomalies: Extreme price movements in BTC and other cryptocurrencies acted as outliers, skewing the correlation calculations.
Analytical Explanation:
- Market Panic: The collapse led to widespread panic among crypto investors, causing a flight to safety and a divergence from the behavior of traditional stock markets.
- Liquidity Crisis: The crash also created liquidity issues within the crypto market, exacerbating the decoupling from stock indices as traditional investors stayed cautious.
FTX Downfall (November 2022)
The downfall of FTX, a major cryptocurrency exchange, in November 2022 had a massive impact on the market, leading to significant losses and a confidence crisis in the crypto sector. The collapse was due to allegations of financial misconduct, which triggered a domino effect across the crypto ecosystem.
Observations from the Correlation Chart:
- Significant Drop in Correlations: The chart shows another sharp decline in both BTC-NASDAQ and BTC-NDXT correlations during November 2022.
- Extended Volatility: The aftermath of the FTX collapse resulted in prolonged volatility and market instability.
Statistical Explanation:
- Heightened Volatility: The FTX collapse created a period of heightened volatility and uncertainty, leading to erratic movements in BTC prices compared to stocks.
- Rolling Window Sensitivity: As new volatile data points entered the rolling window, the correlation calculations were significantly impacted, reflecting the market turmoil.
Analytical Explanation:
- Trust Deficit: The collapse led to a severe trust deficit in the crypto market, prompting investors to pull out funds from BTC and other cryptocurrencies.
- Flight to Safety: As with the Luna crash, there was a flight to safer assets, resulting in a divergence from the behavior of tech and broader stock markets.
- Regulatory Scrutiny: The FTX collapse also brought increased regulatory scrutiny, further unsettling the market and contributing to the decoupling from traditional financial markets.
The Luna and FTX market crashes profoundly impacted the correlations between BTC-NASDAQ and BTC-NDXT. Both events led to sharp declines in correlations due to:
- Volatility Shocks: Sudden and extreme price movements disrupted usual market patterns.
- Market Panic and Liquidity Crises: Investor panic and liquidity issues led to a flight to safety, causing a divergence in the behavior of cryptocurrencies and stocks.
- Trust Deficit and Regulatory Scrutiny: Crises of confidence and increased regulatory scrutiny further unsettled the crypto market, leading to temporary breakdowns in correlations.
Correlation Patterns in Recent History
In the last year (since July 2023), the correlation for both the data points has recovered from its bottom of 0.3, even turning slightly positive since April 2024. The upward trajectory may be attributed to some economic and market developments.
Global Economic Recovery and Stabilizing Inflation
By mid-2023, global economies have largely recovered from the impacts of the COVID-19 pandemic. Economic growth has picked up, leading to increased investor confidence. As economies stabilize, both stock markets and BTC have benefited from improved sentiment, leading to more synchronized movements and higher correlations.
Inflation rates in major economies have begun to stabilize, easing concerns about runaway inflation that dominated markets in 2022 and early 2023. Stable inflation contributes to a more predictable economic environment, reducing market volatility and aligning movements in BTC and stock indices.
Monetary Policy Adjustments
The Federal Reserve and other central banks have moderated the pace of interest rate hikes as inflation shows signs of easing. This has helped to stabilize financial markets. A more predictable interest rate environment reduces market uncertainty, leading to synchronized movements in risk assets like BTC and stocks.
Central banks have slowed down the pace of quantitative tightening, maintaining adequate liquidity in the markets. Adequate liquidity supports asset prices across the board, contributing to higher correlations between BTC and stock indices.
Technological and Sectoral Dynamics
The tech sector (NDXT) has shown resilience with ongoing innovations and strong earnings reports, particularly in A.I. and emerging companies like NVIDIA. As BTC is often viewed similarly to tech stocks due to its innovative and speculative nature, positive movements in the tech sector bolster BTC prices, increasing correlations.
Bitcoin ETF Approvals
The approval of Bitcoin ETFs and increased institutional adoption of cryptocurrencies have boosted BTC's credibility and integration into mainstream finance. As BTC becomes more integrated with traditional financial systems, its price movements increasingly reflect broader market trends, enhancing correlations with stock indices.
Implications for Investors
- Diversification Strategies: Understanding the increasing correlations can inform diversification strategies. During periods of high correlation, the benefits of diversifying between BTC and stocks may be reduced.
- Market Timing and Risk Management: Investors can use the knowledge of rising correlations to adjust their market timing and risk management strategies, potentially aligning their investments in BTC with broader market trends.
- Investment Decisions: Increased integration of BTC into traditional financial systems suggests that its price movements may continue to reflect broader market dynamics, making it a more viable component of diversified portfolios.
By recognizing and understanding these macroeconomic and market factors, investors can make more informed decisions and better navigate the complex interactions between cryptocurrencies and traditional financial markets.
Regression Analysis Results and Discussion
Regression analysis measures the relationship between a dependent variable and an independent variable. In the previous section, we analyzed the correlation between BTC and NASDAQ, which gave us interesting inferences about investor behavior trading patterns. However, other factors ignored in the previous study may also be influencing our results.
Macroeconomic factors like the federal funds rate are important factors investors follow to guide their investment decisions. A rise in federal rates makes them more risk-averse, while a falling rate adds liquidity to the market and encourages investors to take risks.
While factors like federal rates do influence risk asset prices in general, checking if they also influence the correlation between risk assets can strengthen our research and optimize our findings. This section will use regression analysis with BTC-NASDAQ correlation and 5Y monthly federal funds rate data as the independent variable to assess their relationship.
The correlation data was first converted into monthly average correlation to cross-reference it with the federal funds rate easily. You will find all the data in the spreadsheet attached to the research. After conducting the regression on Excel, the results were:
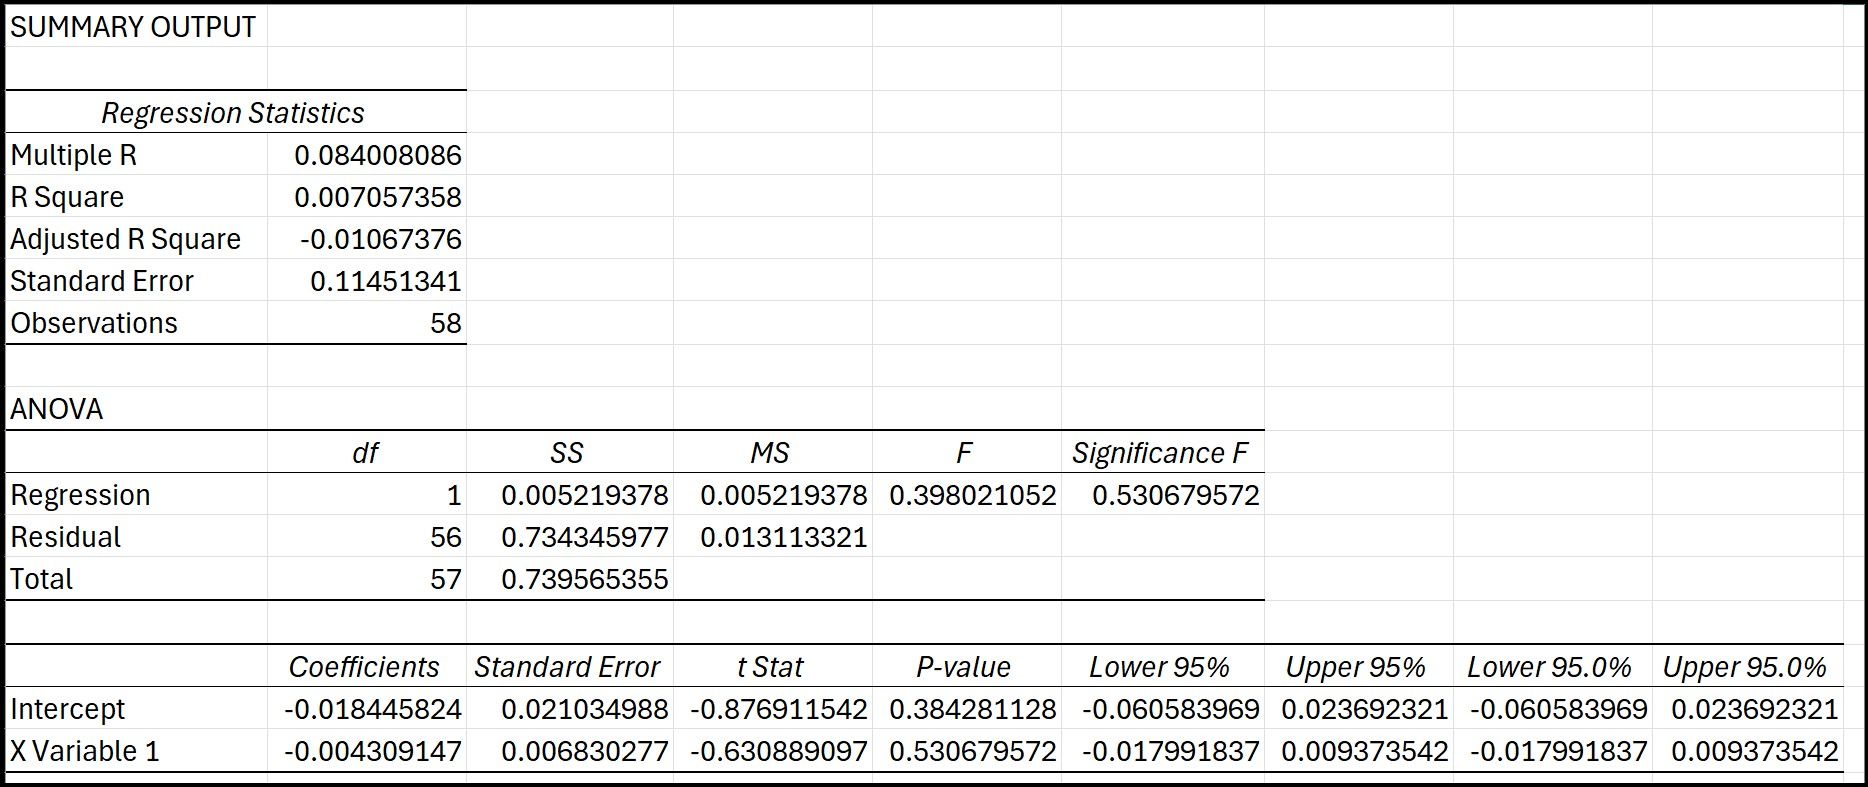 Regression Results from Excel
Interpretation
- R-Squared and Adjusted R-Squared: Both values are very low, indicating that the FED FUNDS RATE explains only a tiny fraction of the variance in the BTC-NASDAQ correlation. The Adjusted R-squared being negative suggests that the independent variable does not improve the model more than a simple mean of the dependent variable would.
- F-Statistic and Significance F: The F-statistic is 0.398021052 with a Significance F (p-value) of 0.530679572, greater than 0.05. This statistic suggests that the overall regression model is not statistically significant, meaning the FED FUNDS RATE has no significant linear relationship with the BTC-NASDAQ correlation.
- Coefficients:
- The Intercept and FED FUNDS RATE coefficients both have high p-values (0.384281128 and 0.530679572, respectively), much greater than 0.05, indicating that neither the intercept nor the FED FUNDS RATE is statistically significant at the 5% significance level.
- The negative coefficient for the FED FUNDS RATE (-0.004309147) suggests a slight negative relationship with the BTC-NASDAQ correlation, but given the high p-value, this relationship is not statistically significant.
- Standard Error and Confidence Intervals: The confidence intervals for both coefficients include zero, further indicating that the effect of the FED FUNDS RATE on the BTC-NASDAQ correlation is not statistically significant.
Regression Conclusion
The regression analysis suggests no statistically significant relationship exists between the FED FUNDS RATE and the average monthly BTC-NASDAQ correlation for the data period analyzed. The FED FUNDS RATE explains only a small portion of the variability in the BTC-NASDAQ correlation, and both the intercept and the independent variable's coefficients are not statistically significant.
The absence of a significant relationship is a valuable finding and can provide important insights into the correlation between BTC and stocks. The absence can suggest some implications:
- Market Independence: The BTC-NASDAQ correlation may be influenced by factors specific to the cryptocurrency market and investor sentiment towards BTC rather than traditional macroeconomic indicators.
- Investor Behavior: The behavior of investors towards BTC and stocks may be driven by different motivations, such as technological advancements in the crypto space, regulatory developments, or specific events impacting the cryptocurrency market.
Research Analysis Findings
The correlation between Bitcoin and NASDAQ has been erratic, showing both positive and negative values over different periods. While the regression analysis has established that macroeconomic factors like the FED FUNDS RATE do not significantly influence this correlation, other factors may explain the erratic nature of the BTC-NASDAQ correlation.
1. Market Sentiment and Speculation
- Investor Behavior:
- FOMO and Panic Selling: Bitcoin and tech stocks are often driven by investor sentiment. Fear of missing out (FOMO) can lead to sharp increases in correlation as investors rush to buy both assets. Conversely, panic selling can lead to sharp declines.
- Speculative Trading: High volatility and speculative trading in both BTC and tech stocks can cause rapid shifts in correlation. Speculative bubbles or crashes in either market can influence correlation values.
- Social Media and News:
- Influence of News: Positive or negative news regarding cryptocurrencies or major tech companies can sway investor sentiment, leading to erratic movements in correlation.
- Social Media Trends: Platforms like Twitter and Reddit can drive investor behavior in both BTC and stocks, leading to sudden and unpredictable correlation changes.
2. Technological Developments and Adoption
- Blockchain and Crypto Innovations:
- New Technologies: Innovations in blockchain technology and new cryptocurrency projects can affect BTC's price independently of the stock market.
- Adoption Rates: Changes in adoption rates of BTC and other cryptocurrencies by both retail and institutional investors can lead to fluctuating correlations.
- Tech Sector Dynamics:
- Tech Company Performance: The performance of major tech companies, especially those involved in cryptocurrency or blockchain technology, can influence the BTC-NDXT correlation more strongly than the broader BTC-NASDAQ correlation.
- Earnings Reports: Quarterly earnings reports from tech giants can cause significant market movements, impacting correlations.
3. Regulatory and Legal Developments
- Cryptocurrency Regulations:
- Regulatory Announcements: Regulatory news, such as the approval or banning of cryptocurrencies in major markets, can lead to sudden changes in BTC prices, impacting correlation.
- Legal Actions: High-profile legal actions against cryptocurrency exchanges or projects can cause sharp declines in BTC prices, affecting correlation with stock markets.
- Tech Sector Regulations:
- Antitrust and Privacy Laws: Changes in regulations affecting tech companies, such as antitrust actions or new privacy laws, can lead to significant movements in tech stocks, influencing correlations with BTC.
4. Market Liquidity and Institutional Involvement
- Liquidity Crises:
- Crypto-Specific Liquidity: Liquidity crises in the cryptocurrency market, such as exchange failures or large-scale hacks, can lead to sharp declines in BTC prices, impacting correlations.
- Broader Market Liquidity: Changes in market liquidity due to actions by central banks or major financial institutions can affect both BTC and stock markets.
- Institutional Investment:
- Entry and Exit of Institutions: The entry of institutional investors into the BTC market can lead to higher correlations with stock markets, as these investors often trade across multiple asset classes.
- Hedging Strategies: Institutional hedging strategies involving BTC and tech stocks can influence correlations, especially during periods of market stress.
The erratic movement of the BTC-NASDAQ correlation can be attributed to a complex interplay of factors beyond traditional macroeconomic forces. By acknowledging these diverse influences, investors and analysts can make more informed decisions in a rapidly evolving market landscape.

Final Thoughts
The study has concluded that the stock market, represented by the NASDAQ index, is not an ideal forward metric for predicting the movements of Bitcoin. While both assets share some speculative characteristics, their reactions to market events often differ significantly. Bitcoin tends to react more sharply to market events, skewing away from stocks and causing the erratic correlations observed in our analysis.
However, with increasing adoption and liquidity, the correlation between Bitcoin and the stock market is becoming more stable. Despite this trend, the correlation still ranges between 0.2 and -0.3, indicating a weak positive and negative relationship between the assets. This weak correlation underscores that while there may be some periods of alignment, Bitcoin and stocks largely move independently.
Bitcoin's price movements are significantly influenced by factors unique to it and the broader crypto sector, such as regulatory developments, technological advancements, and market sentiment specific to cryptocurrencies. These unique influences contribute to the distinct behavior of Bitcoin compared to traditional financial assets.
For investors, the weak relationship between Bitcoin and the stock market offers portfolio diversification opportunities. Although both assets may respond to macroeconomic forces, their weak correlation suggests they respond to different degrees and often independently. By recognizing the independent behavior of these assets, investors can better manage risk and potentially enhance the performance of their investment portfolios.
In conclusion, while Bitcoin and stocks share some commonalities, their differences in reaction to market events and underlying influences highlight the importance of considering a broad range of factors when making investment decisions. The evolving nature of Bitcoin's market dynamics will continue to shape its relationship with traditional financial markets, providing ongoing opportunities for research and investment strategy development.