For a long time, Solana was viewed mainly as the fast and cheap alternative to Ethereum. In 2026, the investment case is much broader. The network has become one of the busiest ecosystems in crypto, supporting DeFi, stablecoins, payments, staking, trading, consumer apps and a growing list of institutional products.
That growth has attracted both supporters and critics. Bulls point to rising on-chain activity, expanding stablecoin liquidity, ETF access and major upgrades such as Firedancer and Alpenglow. Bears argue that Solana still faces competition, volatility, regulatory uncertainty and questions about how much activity comes from speculative trading.
This guide examines whether Solana is a good investment in 2026, looking at its adoption, risks, valuation, staking opportunities and long-term outlook to help you decide if SOL deserves a place in your portfolio.
Editor's Note (May 29, 2026): This article was fully updated in May 2026 to reflect Solana’s latest market data, network performance, staking landscape, ETF access, ecosystem activity and investment risks. We also refreshed the verdict, portfolio guidance, competitor comparisons and risk sections to give readers a clearer view of whether SOL fits their portfolio today.
Quick Verdict: Is Solana a Good Investment in 2026?
Solana may be a good investment for risk-tolerant investors who want exposure to fast, low-cost blockchain activity, DeFi, stablecoins, payments, staking and consumer crypto. It is a high-beta crypto asset, not a capital-preservation holding.
Why Solana May Appeal To Investors
-
Strong usage Solana has active DeFi, DEX, stablecoin, wallet, payment, NFT, memecoin and consumer app activity.
-
Fast and cheap transactions Low fees and fast confirmations make Solana attractive for small transactions, trading, mobile apps and retail users.
-
Growth upside SOL can benefit if Solana keeps gaining users, liquidity, app revenue, developer activity and institutional access.
Why Solana May Not Fit Every Risk Profile
-
High volatility SOL can fall sharply during market stress, even when network activity remains strong.
-
Reliability risk Solana’s uptime has improved, but investors should still monitor outages, congestion and validator-client risk.
-
Competition risk Ethereum L2s, Base, Sui, Aptos and other smart contract platforms compete for users, liquidity and builders.
| Investor Type | Is Solana A Fit? | Why |
|---|---|---|
| Long-Term Crypto Investor | Yes | Strong smart contract platform exposure if sized properly. |
| Active Trader | Maybe | High liquidity and volatility, but requires strict risk controls. |
| Staker Or Yield Seeker | Maybe | Staking can add yield, but price risk remains much larger. |
| Conservative Investor | Probably Not | SOL is too volatile for capital preservation. |
| Beginner Crypto Investor | Maybe | Only after understanding custody, volatility and position sizing. |
| Bitcoin And Ethereum Holder | Maybe | SOL can work as a smaller high-beta smart contract allocation. |
Disclaimer
This guide is educational only and is not financial advice. Solana is a high-risk crypto asset, and SOL can move sharply in either direction. Before buying SOL, confirm the ticker, supported network, trading pair, staking method, withdrawal options and exchange availability in your jurisdiction. Avoid fake SOL tokens, unsupported networks, excessive leverage and hype-driven entries. Only use money you can afford to lose, and decide how you would sell before you buy.
Disclosure
Some links in this guide may be affiliate links. If you choose to use a service through these links, we may earn a commission at no additional cost to you.

Solana Investment Scorecard
| Category | Score | What It Means |
|---|---|---|
| Adoption | High | Strong activity across DeFi, DEXs, stablecoins, wallets and apps |
| Technology | High | Fast, cheap transactions, but network reliability still needs monitoring |
| Ecosystem traction | High | Strong DeFi, memecoin, NFT, consumer app and payment activity |
| Tokenomics | Medium | Staking demand helps, but inflation and unlock context still need attention |
| Risk | High | SOL can fall hard during market stress |
| Competition | High | Ethereum L2s, Sui, Aptos and Base compete for users and builders |
| Investor fit | Selective | Better for risk-tolerant investors than conservative portfolios |
Who Should Consider Buying Solana?
SOL is not suitable for every investor. The asset makes the most sense when the buyer has a clear time horizon, strong risk tolerance, proper custody habits and a controlled allocation.
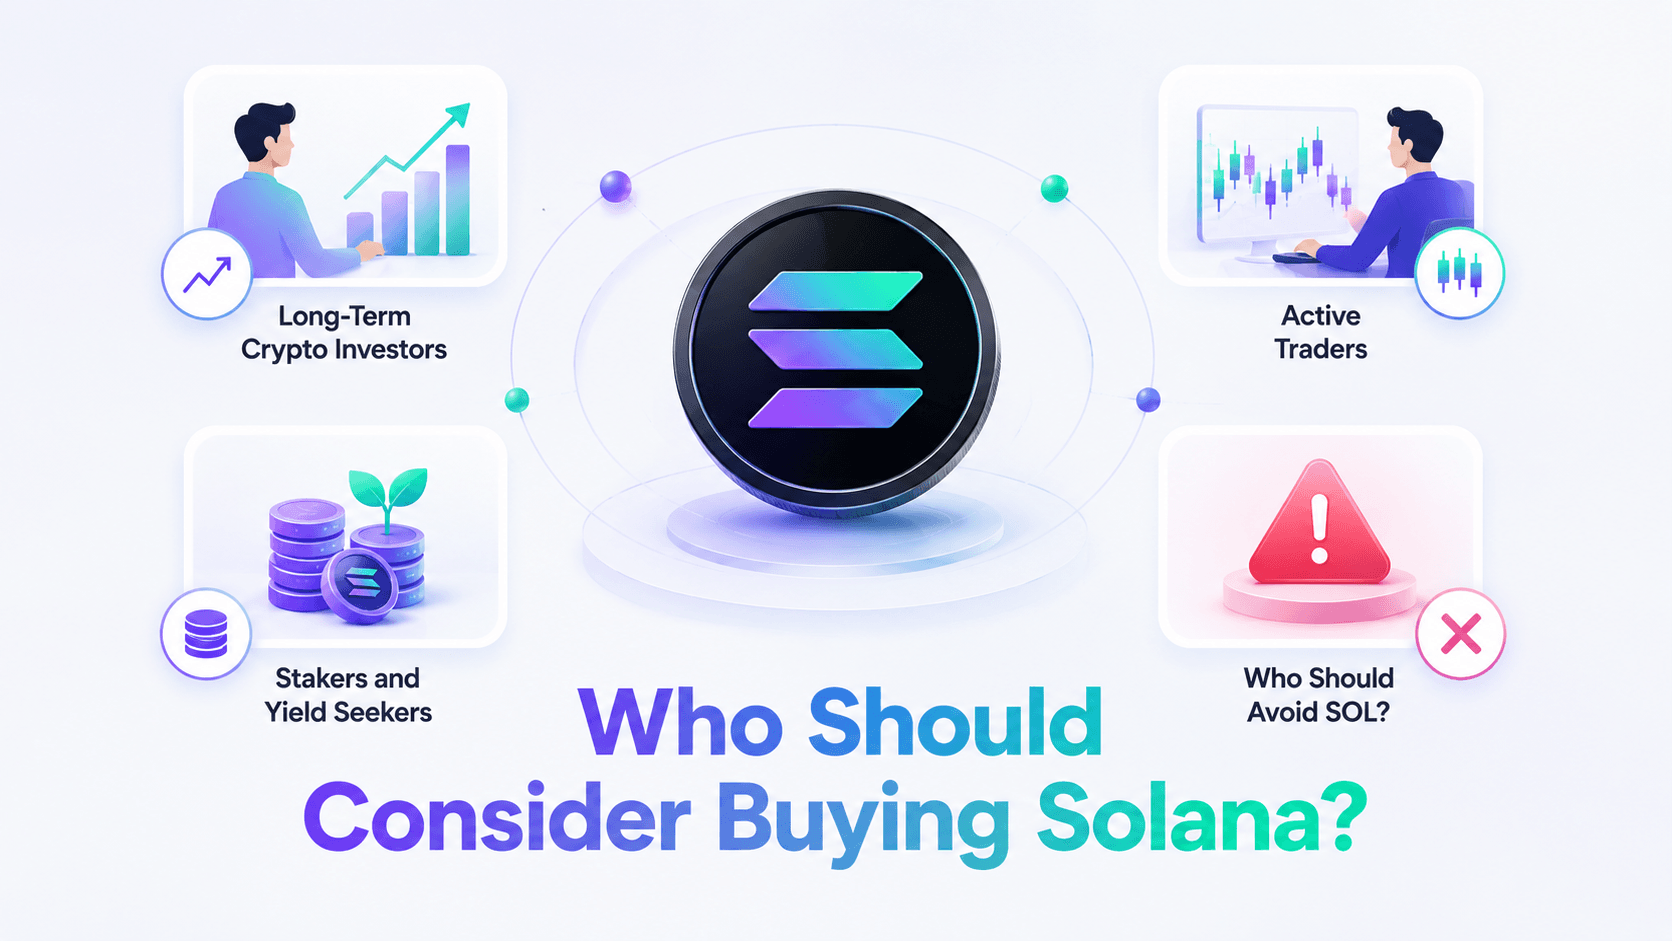 Solana May Suit Long-Term Investors, Active Traders And Stakers Who Accept High Volatility
Long-Term Crypto Investors
SOL may fit long-term crypto investors who already hold BTC and ETH and want extra exposure to high-growth smart contract platforms. The long-term investment thesis is that Solana can capture more activity across DeFi, stablecoins, payments, trading, wallets, mobile apps, NFTs and consumer crypto.
The upside potential comes from growth. Solana is smaller than Ethereum by market cap, stablecoin liquidity and DeFi depth, so stronger adoption can change investor perception faster. More users can create more transactions, more app fees, more demand for blockspace, more staking demand and more liquidity across the ecosystem.
Active Traders
SOL has high liquidity and strong volatility, which can make it attractive for active traders. It often reacts quickly to crypto market sentiment, ETF narratives, memecoin cycles, network headlines, stablecoin growth, DEX volume and altcoin rotation.
Trading SOL requires discipline. Traders should track support and resistance levels, wait for breakout confirmation where relevant, set stop losses before entering and define position size based on risk per trade. Futures traders should also monitor funding rates and open interest.
Stakers and Yield Seekers
SOL staking can add yield for holders, but staking does not remove price risk. Native staking lets users delegate SOL to validators and earn rewards for helping secure the network. Solana’s staking materials describe rewards as issued once per epoch and deposited into the stake account that earned them.
Stakers should check validator commission, uptime, skipped votes and concentration risk. A validator with high commission can reduce net staking returns. A validator with weak uptime can miss rewards. A validator set that becomes too concentrated can weaken decentralization.
Liquid staking adds more flexibility. Jito offers JitoSOL, while Marinade offers mSOL. These liquid staking tokens represent staked SOL in tokenized form. Users can hold them, trade them or use them in DeFi. The benefit is flexibility. The risk is extra smart contract exposure, liquidity risk and possible depeg risk during stressed markets.
Who Should Avoid SOL?
Avoid SOL if you need stability. Solana is not a capital-preservation asset, and staking rewards are not enough to offset a large market drawdown.
SOL is also a poor fit for readers who cannot handle 40% to 70% drawdowns, already have heavy altcoin exposure, do not understand self-custody or wallet security, or are buying only because of a price prediction. Strong technology does not guarantee strong investor returns, especially if the token is bought at an aggressive valuation.
Custody is part of the risk. If you self-custody SOL, you are responsible for seed phrase security, wallet approvals, phishing protection and network selection. If you hold SOL on an exchange, you carry exchange custody risk.
Readers who need storage help can start with our guides to best crypto wallets, best hardware wallets and best crypto wallets for beginners.
Why Solana Could Be a Good Investment
The bull case for Solana rests on usage. Low fees, fast settlement, DeFi liquidity, stablecoins, developer activity, institutional access and network upgrades all support SOL if they translate into durable demand.
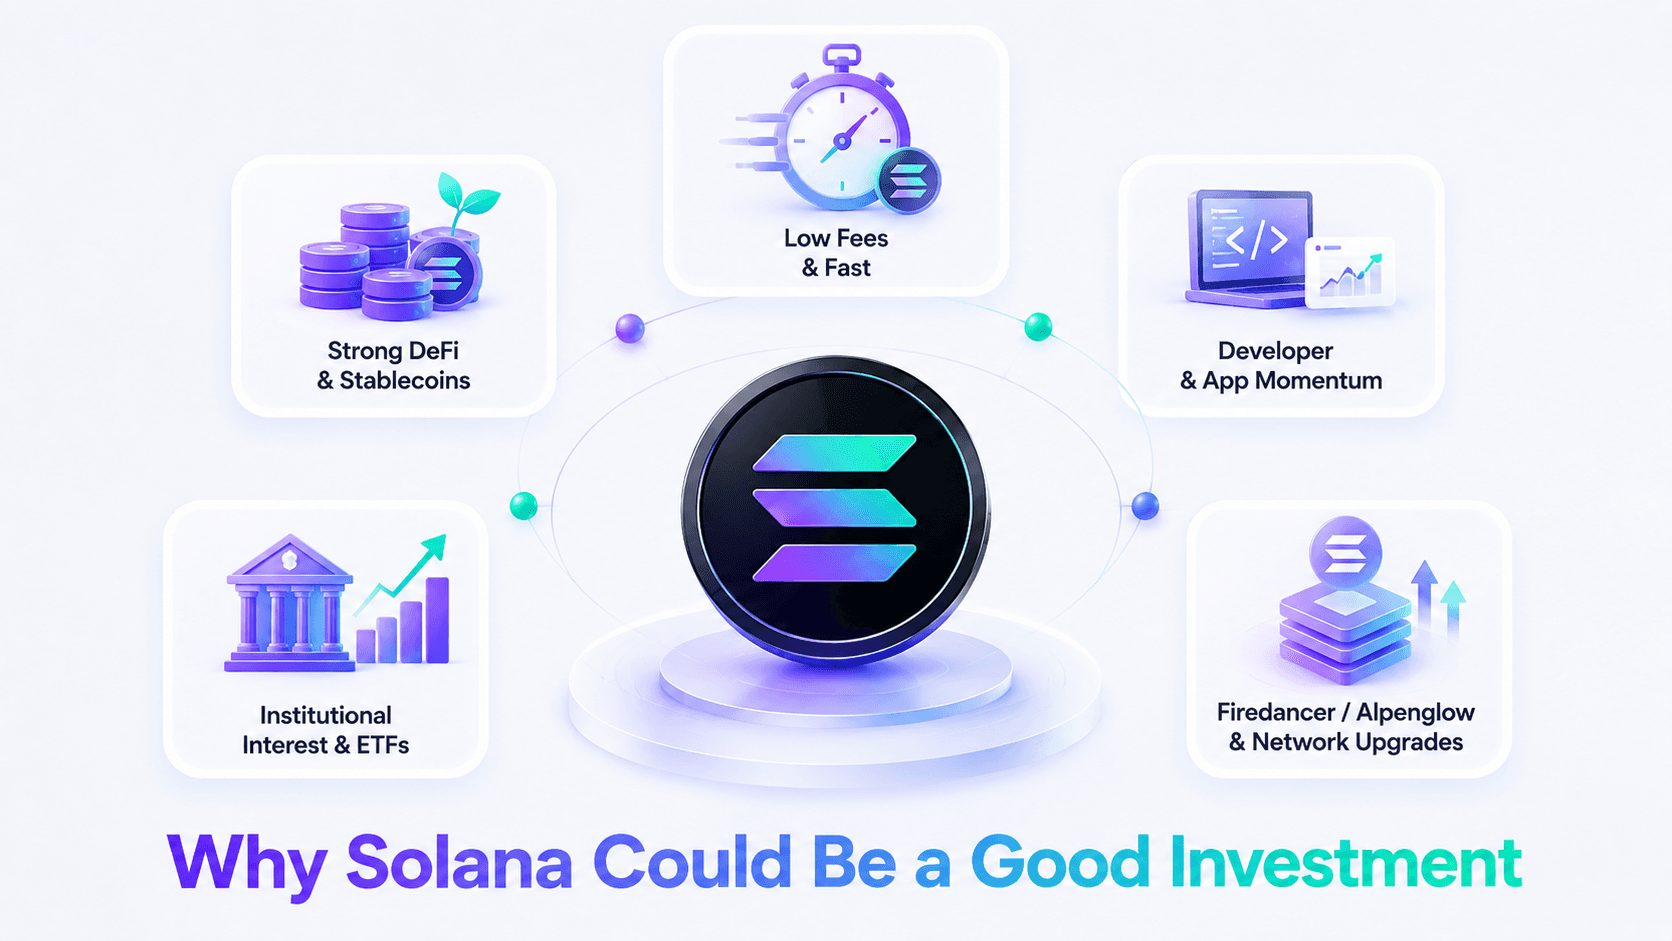 Solana’s Bull Case Centers On Fast Transactions, Low Fees, App Growth And Network Upgrades
Low Fees and Fast Transactions
Solana’s main user-facing advantage is clear: transactions are fast and cheap. The network is designed for high-throughput activity, which gives it a strong position in use cases where high fees damage the user experience.
Solana uses Proof of Stake and Proof of History. Proof of Stake means validators secure the network using staked SOL. Proof of History is a timing mechanism that helps the network order events efficiently before consensus. That design supports fast settlement and low transaction costs.
Solana transaction fees include a base fee of 5,000 lamports per signature and optional priority fees. A lamport is the smallest unit of SOL, with 1 SOL equal to 1 billion lamports.
Priority fees can rise during congestion, and protocols may charge separate fees. Solana’s docs state that the base fee is split 50% burned and 50% paid to the validator, while 100% of priority fees go to validators. Token prices and transaction costs in dollar terms can change quickly.
Low fees support high-frequency consumer behavior. Users can swap small amounts, mint NFTs, move stablecoins, interact with games, trade memecoins, test DeFi strategies and use mobile wallets without paying several dollars per transaction. That gives Solana a stronger retail experience than high-fee Layer 1 environments.
Strong DeFi, DEX and Stablecoin Activity
Solana’s DeFi footprint is one of the strongest parts of the investment case. TVL shows capital inside DeFi applications. Stablecoin supply shows liquidity for trading, payments and settlement. DEX volume shows trading demand. Active addresses and transaction counts show usage, though bots and automated strategies can inflate both.
| Solana Metric | May 2, 2026 Snapshot (via DeFiLlama) |
|---|---|
| DeFi TVL | About $5.28 billion |
| Stablecoin market cap | About $14.82 billion |
| 24-hour DEX volume | About $1.06 billion |
| 7-day DEX volume | About $7.896 billion |
| 24-hour active addresses | About 1.92 million |
| 24-hour transactions | About 78.3 million |
| 24-hour chain fees | About $432,724 |
| 24-hour chain revenue | About $54,112 |
| 24-hour app fees | About $4.81 million |
| 24-hour app revenue | About $1.99 million |
Note: DeFiLlama metrics can change throughout the day and may vary depending on methodology, dashboard settings and indexing updates. Treat these figures as a point-in-time snapshot, not permanent network totals.
Those figures show that Solana is not only a speculative token. It has a working on-chain economy with trading, lending, staking, liquidity routing, stablecoin movement and app revenue.
Jupiter is a central Solana DeFi hub for swaps, routing, lending, perps, wallet tools and app access.
Kamino offers lending, liquidity and leverage products on Solana.
Raydium is a Solana AMM and DEX liquidity protocol.
Sanctum focuses on Solana liquid staking infrastructure and LST liquidity.
For deeper analysis, read our guide to the Top Solana Projects.
Developer and App Momentum
Developer activity helps investors because apps create the user surface area of a blockchain. Users interact with wallets, exchanges, games, payment tools, NFT platforms and DeFi apps, not abstract throughput claims.
Solana has built a strong identity around consumer crypto and retail UX. Low fees and fast confirmations support wallets, mobile trading, NFT minting, memecoin launch platforms, DeFi dashboards and payments. The Solana ecosystem also markets itself around payments, capital markets and crypto applications, which gives builders a clear direction.
According to Electric Capital, Solana has over 890 developers. More builders can lead to more apps. More apps can bring more users.
Institutional Interest and Solana ETFs
Institutional access improved after spot Solana ETPs became available in the U.S. market. Bitwise announced the Bitwise Solana Staking ETF, ticker BSOL, as the first U.S. spot Solana ETP, with trading scheduled on NYSE from Oct. 28, 2025. Bitwise listed a 0.20% management fee and a 0% fee waiver for the first three months on the first $1 billion in assets.
The official BSOL fund page showed, as of May 27, 2026, a net staking reward rate of 6.01%. Those reward figures are not guaranteed and can change with network conditions, validator performance and fund operations.
The regulatory backdrop also changed. The SEC approved generic listing standards for commodity-based trust shares in September 2025, which streamlined the listing process for eligible spot commodity ETPs, including some digital asset products. This improved access, but it did not remove market risk or create guaranteed demand for SOL.
ETFs can help SOL demand by giving institutions and brokerage-account investors regulated access without direct wallet custody. They can also create demand from allocators who cannot hold spot SOL directly.
ETF narratives have limits. ETF flows can reverse. AUM can fall with price. Staked ETF products add operational and regulatory considerations. Institutional access does not remove SOL volatility, competition or network risk.
Firedancer, Alpenglow and Network Upgrades
Network upgrades are relevant because reliability remains part of Solana’s investment case. The official Solana network upgrade tracker lists upgrades including Alpenglow, larger transaction size, block revenue distribution and compute-related changes. It also warns that version numbers and timelines can change.
Firedancer is important because it improves validator client diversity. A validator client is software validators use to participate in the network. If most validators rely on one client, a serious bug in that client can create systemic risk. A second independent client lowers single-client risk if it becomes widely adopted and battle-tested.
Firedancer and Frankendancer deployment status should be checked through official releases, the repository and validator adoption data. Investors should avoid treating roadmap language as live production status.
Alpenglow targets faster finality and reliability. It is a new consensus design targeting about 150ms median finality and as fast as 100ms under some conditions, compared with roughly 12.8 seconds from block creation to finality under TowerBFT. The Solana upgrade page listed Alpenglow as under development, so investors should not treat it as fully live until production status is confirmed.
Why Solana Could Be a Bad Investment
The bear case is direct. SOL can be a bad investment if price outruns usage, network issues return, regulation limits access, competitors take share or crypto liquidity weakens.
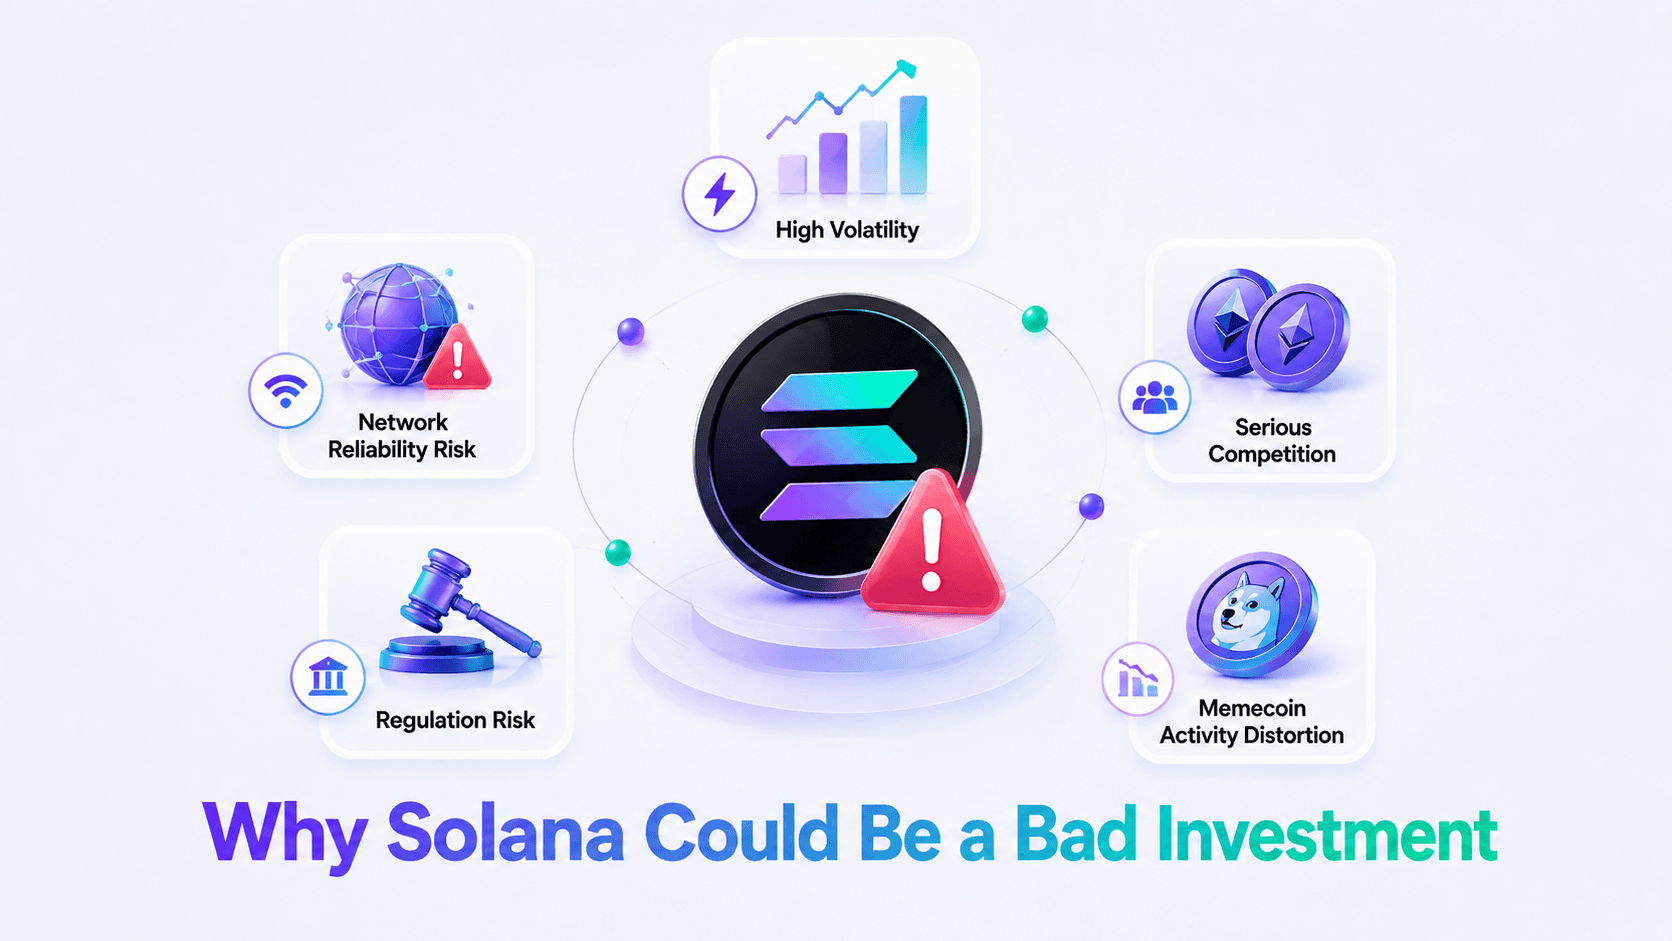 Solana Carries Volatility, Network Reliability, Competition, Regulation And Memecoin-Driven Demand Risks
SOL Is Still Highly Volatile
SOL is a high-beta crypto asset. It can outperform in bull markets and fall harder than BTC or ETH when market sentiment turns.
Deep drawdowns are normal for altcoins. SOL has already shown that investor interest can swing sharply across crypto cycles. A token can have strong network activity and still suffer large losses if risk appetite falls, leverage unwinds or investors rotate into safer assets.
Liquidity cycles drive much of SOL’s price action. When stablecoins, ETFs, DeFi liquidity and retail risk appetite expand, SOL can benefit. When liquidity contracts, SOL can fall quickly. Correlation with crypto market sentiment remains high.
Investors should plan for volatility before buying. A position that feels manageable after a 20% rally may feel too large after a 50% drawdown. Position size should match the investor’s ability to hold, trim or rebalance without panic.
Network Reliability Is Still a Key Risk
Solana’s network reliability record has improved, but uptime remains part of the investment case. The network has experienced major outages in the past, and investors should keep monitoring performance.
The official Solana Status page showed all systems operational and 100% uptime over the past 90 days in a May 29, 2026 snapshot. The Solana uptime history page also showed 100% uptime for March, April and May 2026.
That is encouraging, but it does not erase the risk. A major halt, degraded performance during peak demand or a validator-client issue could damage user confidence. Reliability carries extra weight for Solana because the investment story relies heavily on high-speed, low-fee activity.
Solana Faces Serious Competition
Solana competes with Ethereum, Ethereum L2s, Base, Sui, Aptos and other smart contract platforms. Competition affects liquidity, users, developers, wallet distribution, stablecoin supply and app launches.
Ethereum remains the deepest DeFi ecosystem. Ethereum L2s add pressure because they reduce transaction costs while keeping links to Ethereum liquidity. Base has Coinbase distribution. Arbitrum and Optimism add more Ethereum-aligned scaling competition.
Sui and Aptos compete from the high-throughput Layer 1 side. Sui targets fast applications and consumer use cases, while Aptos uses the Move language and competes for developers, apps and ecosystem funding.
Solana does not need to lose users for competition to hurt SOL returns. If Solana growth slows while its market cap still prices in aggressive adoption, valuation risk rises.
Regulation Could Affect SOL and Staking
Regulation can affect SOL through exchange listings, ETF access, staking products, custody rules, tax treatment and investor eligibility. U.S. access improved after generic ETP listing standards, but crypto regulation remains fluid across jurisdictions.
The SEC’s generic listing standards approval helped eligible commodity-based ETPs, including certain digital asset products, list more efficiently. That was positive for access, not a permanent guarantee that every Solana-related product will receive favorable treatment.
Staking adds another layer. The SEC Division of Corporation Finance issued a statement on certain protocol staking activities, but staff statements can evolve and do not create complete legal certainty in every country or product structure.
Investors should treat regulatory risk as live. Rules can affect centralized exchange offerings, custodial staking programs, ETF staking mechanics, tax reporting and institutional access.
Memecoin Activity Can Distort the Investment Case
Memecoins are a major part of Solana’s public identity. They bring users, fees, wallet downloads, DEX volume and social attention. They also distort investment analysis.
Memecoin trading can inflate activity metrics. High active addresses, transaction counts and DEX volume may reflect short-lived speculation, bots, launch-platform churn or rapid rotation rather than durable product-market fit. That can make Solana look healthier than it is if investors only track top-line activity.
Memecoin activity still has value. It can stress-test infrastructure, onboard new users, create liquidity and push wallets and DEXs to improve. Some users who arrive through memecoins later use stablecoins, DeFi or payments.
The risk is durability. Solana’s stronger investment case comes from stablecoins, recurring DeFi usage, payments, wallets, staking and consumer apps that survive beyond memecoin cycles.
Is Solana Undervalued or Overvalued?
Solana valuation should be treated as a dashboard, not a prediction. SOL can look undervalued if usage grows faster than market cap, and overvalued if price rises faster than durable adoption.
Valuation work should compare SOL price to all-time high, market cap to Ethereum, market cap to other Layer 1s, TVL-to-market-cap ratio, stablecoin supply, DEX volume, fees, revenue, active users, staking participation and price-to-usage trends.
| Metric | What It Shows | Bullish Reading | Bearish Reading |
|---|---|---|---|
| Market cap | Current valuation | SOL still has upside versus ETH | Upside may already be priced in |
| TVL | DeFi capital | Capital is sticky | TVL can leave quickly |
| Stablecoins | Payment and liquidity depth | Strong settlement use | Still smaller than Ethereum |
| DEX volume | Trading demand | High usage | May be memecoin-driven |
| Fees/revenue | Value capture | Real activity | Low fees can limit revenue |
| Active addresses | User demand | Consumer adoption | Bots can inflate numbers |
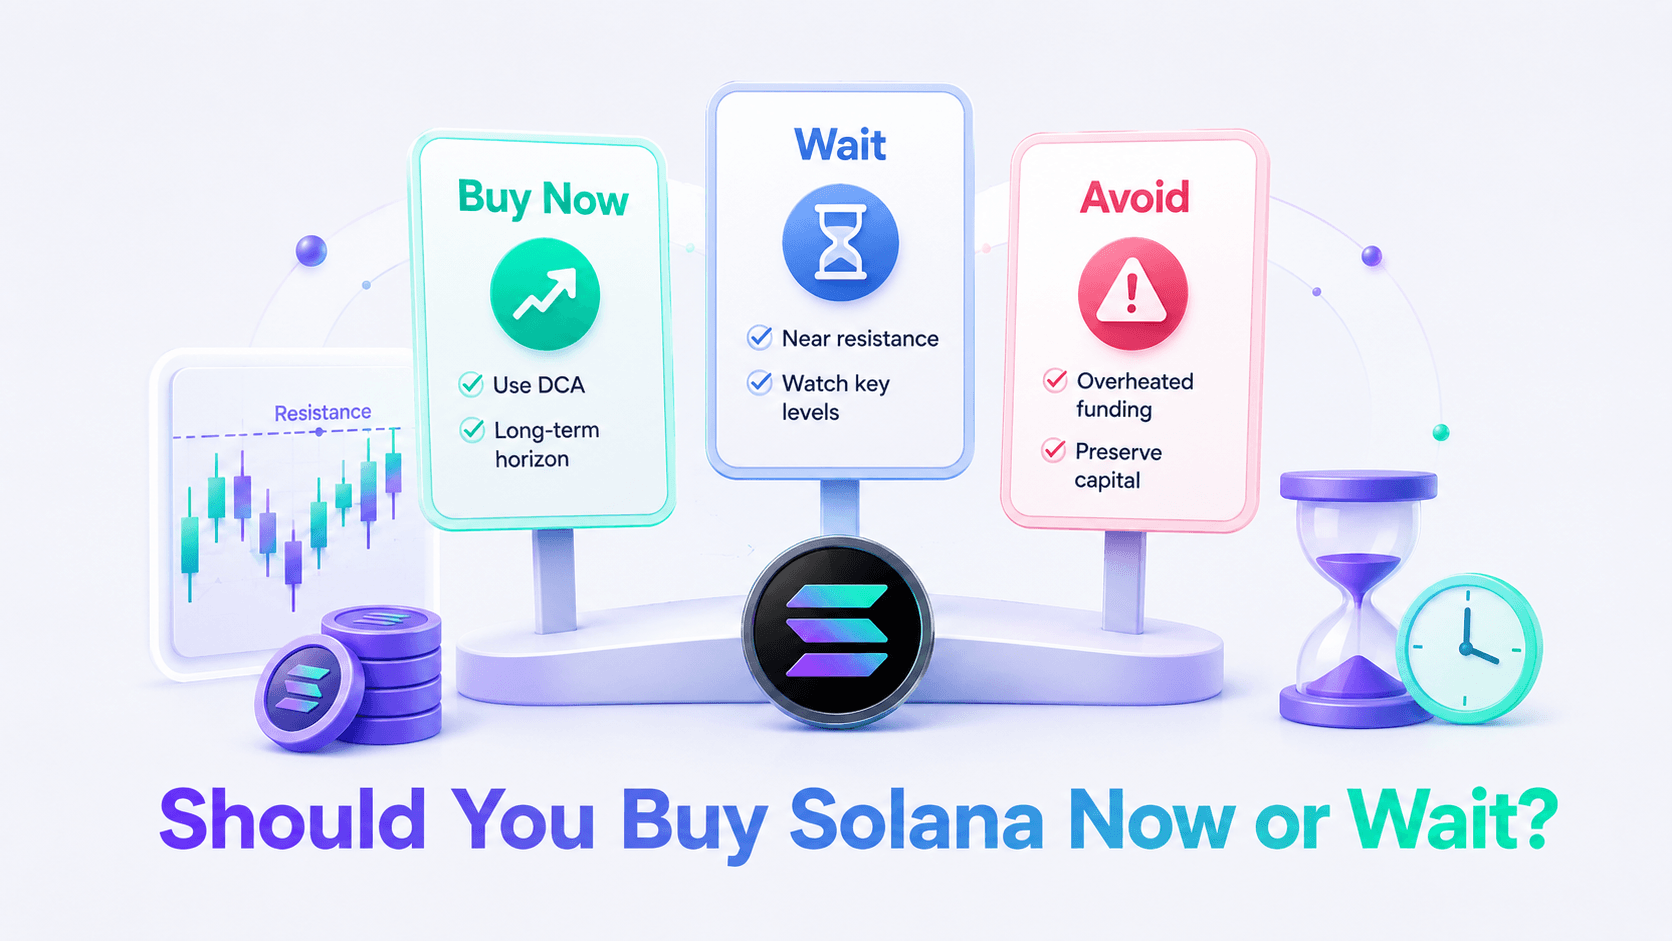
Should You Buy Solana Now or Wait?
The “buy now or wait” question needs rules, not impulse. SOL is too volatile for impulse buying.
 Use DCA, Risk Limits And Market Conditions Before Deciding Whether To Buy SOL
Buy Solana Now If
- You have a long-term investment horizon.
- You have a strong risk tolerance and can handle significant volatility.
- SOL represents only a small portion of your overall crypto portfolio, unless you intentionally follow a higher-risk strategy.
- You can tolerate large drawdowns without being forced to sell.
- You have a clear plan for rebalancing if SOL experiences substantial price gains or losses.
- You prefer a Dollar-Cost Averaging (DCA) approach rather than trying to time the market.
- You want to spread purchases across multiple entry points to reduce timing risk.
Read our full guide on how to buy Solana in 2026.
Wait To Buy Solana If
- Funding rates look overheated.
- Open interest has spiked.
- Price is near major resistance without clear confirmation.
- You want to avoid buying after a sharp move that may already be overextended.
- High open interest and positive funding suggest crowded long positioning.
- Your portfolio already has enough altcoin exposure.
- You already hold several high-risk assets such as BTC, ETH, SOL, Sui, Aptos, AI tokens, gaming tokens or memecoins.
- Your portfolio looks diversified by name but may still behave like one high-risk altcoin basket during market stress.
Avoid Buying Solana If
- You need capital preservation.
- You are treating SOL as a cash substitute.
- You think staking makes SOL stable.
- You are buying only because of price predictions.
- You plan to use leverage without clear trading rules.
- Checking the SOL price affects your work, sleep or daily life.
- The position would be too large or too speculative for your risk tolerance.
DCA vs Lump Sum
DCA usually fits retail investors better because SOL is volatile. It turns one large timing decision into several smaller decisions.
Lump-sum buying can work for experienced investors with strong conviction, attractive valuation work and enough cash reserves to handle drawdowns. It is a higher-pressure approach. If the market falls 30% right after entry, the investor needs the discipline and balance sheet to stay with the plan.
A practical framework: decide the maximum SOL allocation first, then choose how quickly to build it. Do not let a rally decide position size for you.
How Much Solana Should You Own?
SOL allocation should match risk tolerance, existing holdings and time horizon. A strong Solana thesis does not justify an oversized position.
| Investor Type | SOL Allocation Inside Crypto Portfolio | Notes |
| Conservative | 0% to 3% | BTC and ETH should usually come first |
| Balanced | 3% to 8% | Best suited to DCA and rebalancing |
| Growth-focused | 8% to 15% | Higher upside, higher drawdown risk |
| Aggressive | 15% to 20%+ | Only for investors who accept severe volatility |
Conservative investors may not need SOL at all. A BTC and ETH-heavy crypto portfolio already gives exposure to the sector without adding as much altcoin beta.
Balanced investors can use SOL as a smaller growth allocation. A 3% to 8% allocation inside a crypto portfolio can provide exposure without letting SOL dominate total risk.
Growth-focused investors may use 8% to 15%, but that requires comfort with severe drawdowns. A 15% SOL allocation can become painful during altcoin crashes, especially if the investor also holds other high-beta assets.
Aggressive investors may hold 15% to 20% or more, but that is a concentrated bet. It requires active monitoring, strong custody habits and a clear rebalancing plan.
Do not treat SOL like a savings account. Do not let SOL become your entire crypto portfolio. Rebalance after large moves. Keep cash or stablecoins for drawdowns if you actively invest, while remembering that stablecoins carry issuer, peg, custody and platform risks.
Is Staking SOL Worth It for Investors?
Staking SOL can be useful for long-term holders, but it should be judged after inflation, validator fees, liquidity constraints and smart contract risk. Staking rewards do not cancel price volatility.
 SOL Staking Can Add Yield, But Inflation, Fees And Price Risk Still Matter
Native Staking
Native staking means delegating SOL to validators. You keep SOL exposure while helping secure the network and earning rewards.
Native staking variables include validator commission, uptime, skipped votes, stake concentration and unstaking cooldown. Validator commission directly reduces rewards. Weak uptime can lead to missed rewards. Concentrated delegation can weaken decentralization.
Unstaking is not instant. SOL usually needs to deactivate at epoch boundaries before becoming fully liquid again. That cooldown may be manageable for long-term investors, but it can be a problem during fast markets.
Native staking also carries custody risk. Users staking from self-custody must protect seed phrases and avoid phishing. Users staking through exchanges or custodians add counterparty risk.
Liquid Staking
Liquid staking gives users a token that represents staked SOL. The two major examples are JitoSOL and mSOL.
Liquid staking offers DeFi flexibility. Users can use liquid staking tokens in lending, liquidity pools or collateral strategies. That flexibility can improve capital efficiency.
The risks are higher than native staking. Liquid staking adds smart contract risk, liquidity risk, depeg risk, oracle risk and app-specific risk if the token is used in DeFi. A user can lose money even if SOL staking itself works as expected.
Real Yield After Inflation
Headline staking APY is not the same as real return. Investors should estimate:
Real yield = staking APY minus SOL inflation minus validator or protocol fees
The BSOL fund page showed a gross staking reward rate of 6.42% and a net staking reward rate of 6.04% as of May 24, 2026, while Solana’s official inflation schedule targets a decline from the initial 8% annual rate toward 1.5% over time. These figures are not universal retail staking returns. Validator choice, commission, custody method, staking pool design and network conditions can change results.
Staking can still be worth it. For long-term SOL holders, staking can reduce dilution relative to holding unstaked SOL. The mistake is treating staking APY as a guaranteed investment return. SOL price can fall far more than staking rewards can offset.
Solana vs Ethereum: Which Is the Better Investment?
Ethereum is usually the more established core smart contract holding. Solana is the higher-risk, higher-upside complement for investors who want faster, cheaper app exposure.
| Factor | Solana | Ethereum |
|---|---|---|
| Risk profile | Higher beta | Lower relative risk |
| Upside potential | Higher if adoption grows | More mature, slower upside |
| Liquidity | Strong, but smaller | Deepest in crypto DeFi |
| Fees | Very low | Higher on L1, lower on L2s |
| Scaling model | Integrated high-speed L1 | L1 plus L2 ecosystem |
| Developer base | Strong growth | Largest overall base |
| Institutional access | Growing | More established |
| Best for | Higher-risk growth exposure | Core smart contract exposure |
Ethereum has the stronger institutional base, deeper DeFi liquidity and broader developer ecosystem. It also has a large Layer 2 network, including Base, Arbitrum and Optimism, which helps reduce fees while keeping users connected to Ethereum liquidity and infrastructure.
Solana has the stronger low-fee retail experience. Users can swap, mint, move stablecoins, use wallets and test apps with very small transaction costs. That makes Solana attractive for consumer crypto, fast trading and mobile-first applications.
The investment choice is about risk profile as much as technology. ETH has lower relative risk because it is more mature, more liquid and more established. SOL has higher upside potential if Solana keeps gaining adoption, but it also carries higher downside risk.
Use ETH if you want core smart contract exposure with deeper liquidity and a longer track record. Use SOL if you want higher-risk exposure to faster, cheaper blockchain activity and can handle stronger drawdowns.
Many portfolios can hold both. ETH can act as the main smart contract platform allocation. SOL can act as a smaller high-beta allocation. The sizing should reflect the risk gap.
Solana vs Sui, Aptos and Base
Solana’s investment case must be judged against competitors. Sui, Aptos, Base and Ethereum L2s all compete for users, liquidity, builders and mindshare.
| Competitor | Why It Competes With Solana | Investor Takeaway |
|---|---|---|
| Sui | Fast L1, growing consumer and DeFi activity | Rising competitor, but less proven than Solana |
| Aptos | Move-based L1 with strong funding | Competes for developers and apps |
| Base | Ethereum L2 with Coinbase distribution | Strong retail and app funnel |
| Ethereum L2s | Deep liquidity and Ethereum tooling | Major long-term pressure on Solana |
Sui competes with Solana as a fast Layer 1 built for high-throughput applications. It targets consumer use cases, DeFi and app-level performance. Sui is a rising competitor, but it has less market history than Solana.
Aptos competes through the Move language, strong funding and developer tooling. Aptos can pressure Solana if developers prefer Move-based architecture for certain app categories.
Base competes through distribution. It is an Ethereum Layer 2 built with Coinbase involvement, which gives it a strong retail funnel.
Sui and Aptos remain smaller in several tracked DeFi categories.
Ethereum L2s are the largest long-term competitive threat because they combine lower fees with Ethereum liquidity, tooling and institutional familiarity. Solana’s answer is a simpler integrated Layer 1 user experience and a fast retail app ecosystem.
The investor takeaway is clear: Solana is one of the strongest high-throughput smart contract platforms, but it does not control the category. Competition can reduce SOL upside even if Solana keeps growing.
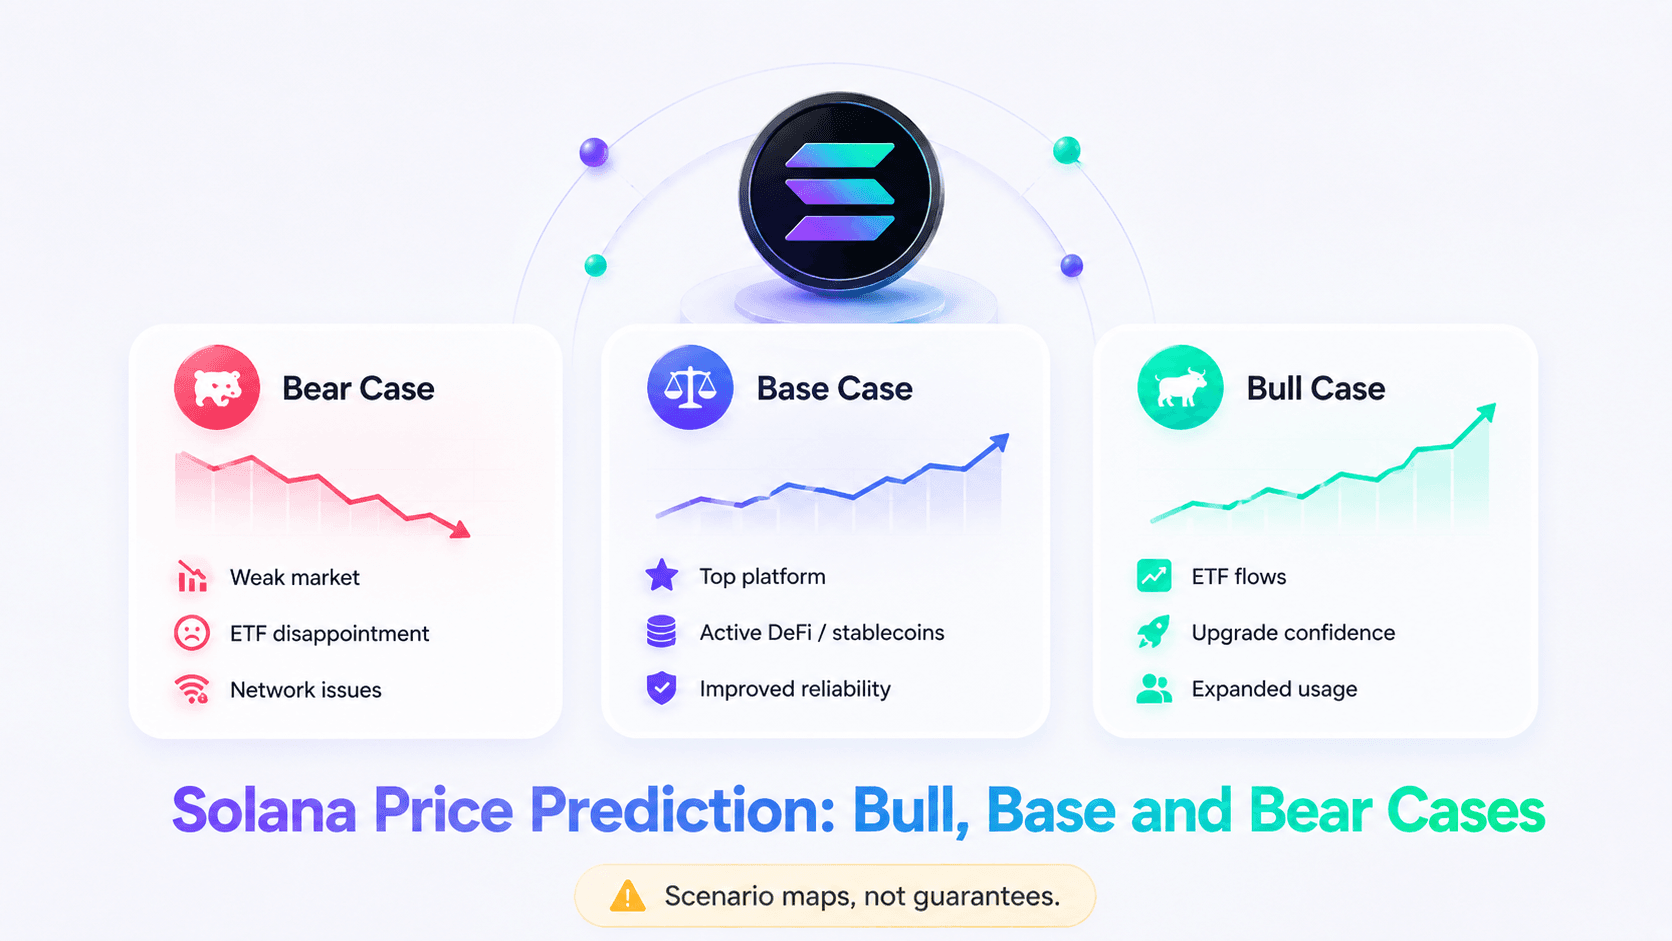
Solana Price Prediction: Bull, Base and Bear Cases
Price predictions are scenario maps, not guarantees. SOL can reach ambitious targets only if adoption, liquidity, market cap and investor demand support them.
 Solana Price Scenarios Depend On ETF Demand, Network Upgrades, Usage And Market Conditions
Bear Case
The bear case starts with a weak crypto market. If liquidity leaves altcoins, SOL can fall even if the network continues to function.
ETF demand could disappoint. Solana ETF flows could turn negative. Network issues could return. Stablecoin liquidity could leave Solana. DeFi TVL could decline. Memecoin activity could fade. Developers could shift attention to Ethereum L2s, Sui, Aptos or Base.
In that scenario, SOL could underperform BTC and ETH. If valuation remains high while usage falls, downside risk increases.
Base Case
The base case is that Solana remains a top smart contract platform. DeFi stays active, stablecoin supply remains strong, DEX volume stays competitive, developers keep building and network upgrades gradually improve confidence.
In this scenario, SOL remains volatile but constructive. The token can recover during stronger market conditions, but investors should still expect sharp corrections.
The base case does not require Solana to beat Ethereum. It requires Solana to keep a strong role in low-fee DeFi, stablecoins, consumer apps, payments, staking and retail trading.
Bull Case
The bull case requires several drivers to align. ETF flows grow. Firedancer and Alpenglow improve confidence. Stablecoin and payment usage expands. Solana captures more consumer app activity. DeFi TVL and app revenue rise. SOL retests or breaks prior highs.
In a strong bull case, targets such as $500 become possible if market cap expansion, liquidity and adoption support them. A $1,000 SOL would require a much larger market cap and major growth across the ecosystem. That is speculative and should not drive portfolio sizing.
Price predictions are scenario maps, not guarantees. A forecast is useful only when it includes the downside path.
What Would Make Solana a Bad Investment?
Solana becomes a bad investment if the market prices SOL for growth while the underlying data weakens.
Important thesis-breakers include:
- Major outage or repeated performance failures
- Sustained TVL decline
- Stablecoin liquidity leaving Solana
- Falling developer activity
- ETF outflows or weak institutional demand
- Validator concentration worsening
- App revenue falling while valuation stays high
- Regulatory action against SOL or staking
- Loss of market share to Ethereum L2s, Sui, Aptos or Base
Each red flag affects the thesis differently. A major outage would challenge Solana’s reliability story. Sustained TVL decline would weaken DeFi confidence. Stablecoin outflows would reduce settlement and trading depth. Falling developer activity would hurt the app pipeline.
ETF outflows would show weaker institutional demand than expected. Validator concentration would raise decentralization concerns. Falling app revenue while SOL’s market cap stays high would increase valuation risk.
Regulatory action could affect exchange listings, staking products, ETF access and custody. Competitor gains could reduce Solana’s growth runway.
Investors holding a large SOL position should monitor these before adding more. A single weak metric may not break the thesis. Several red flags at once can.

Final Verdict: Buy, Hold or Avoid SOL?
Solana can be a strong high-beta crypto investment for the right portfolio, but it should be sized like a risky growth asset. It is not a guaranteed long-term winner.
Buy or DCA
Buy or DCA if you have a long time horizon, strong risk tolerance and limited SOL exposure. The strongest case is a planned allocation, not a reaction to hype.
DCA suits investors who want exposure without trying to time a single entry. Position size still matters. A DCA plan can reduce timing risk, but an oversized allocation can still leave investors overexposed.
Hold
Hold if you already own SOL, remain confident in the investment thesis and are willing to rebalance after large moves.
Holding makes sense when Solana’s DeFi TVL, stablecoins, developer activity, app revenue, ETF access and network reliability remain healthy. Holding becomes weaker if those metrics deteriorate while SOL remains expensive.
Avoid or Wait
Avoid or wait if you have low risk tolerance, heavy altcoin exposure, no plan for volatility or weak custody habits.
Waiting can also make sense after sharp rallies, overheated funding or crowded derivatives positioning. A good asset can still be a poor purchase after an emotional move.
Solana suits users who want high-risk exposure to smart contract platform growth, DeFi, stablecoins, payments, staking and consumer crypto. It is less suited to investors who need capital preservation, stable returns or simple long-term self-custody without active monitoring.