$1 SHIB is mathematically implausible under its roughly 589.24 trillion circulating supply. At $1, Shiba Inu would need a market cap of about $589 trillion, far larger than Bitcoin, Ethereum, the total crypto market, and the global equity market. The more realistic way to view SHIB is as a high-risk meme asset whose upside depends on liquidity cycles, exchange access, whale flows, social momentum, burns, and broader meme-coin rotation.
Quick forecast:
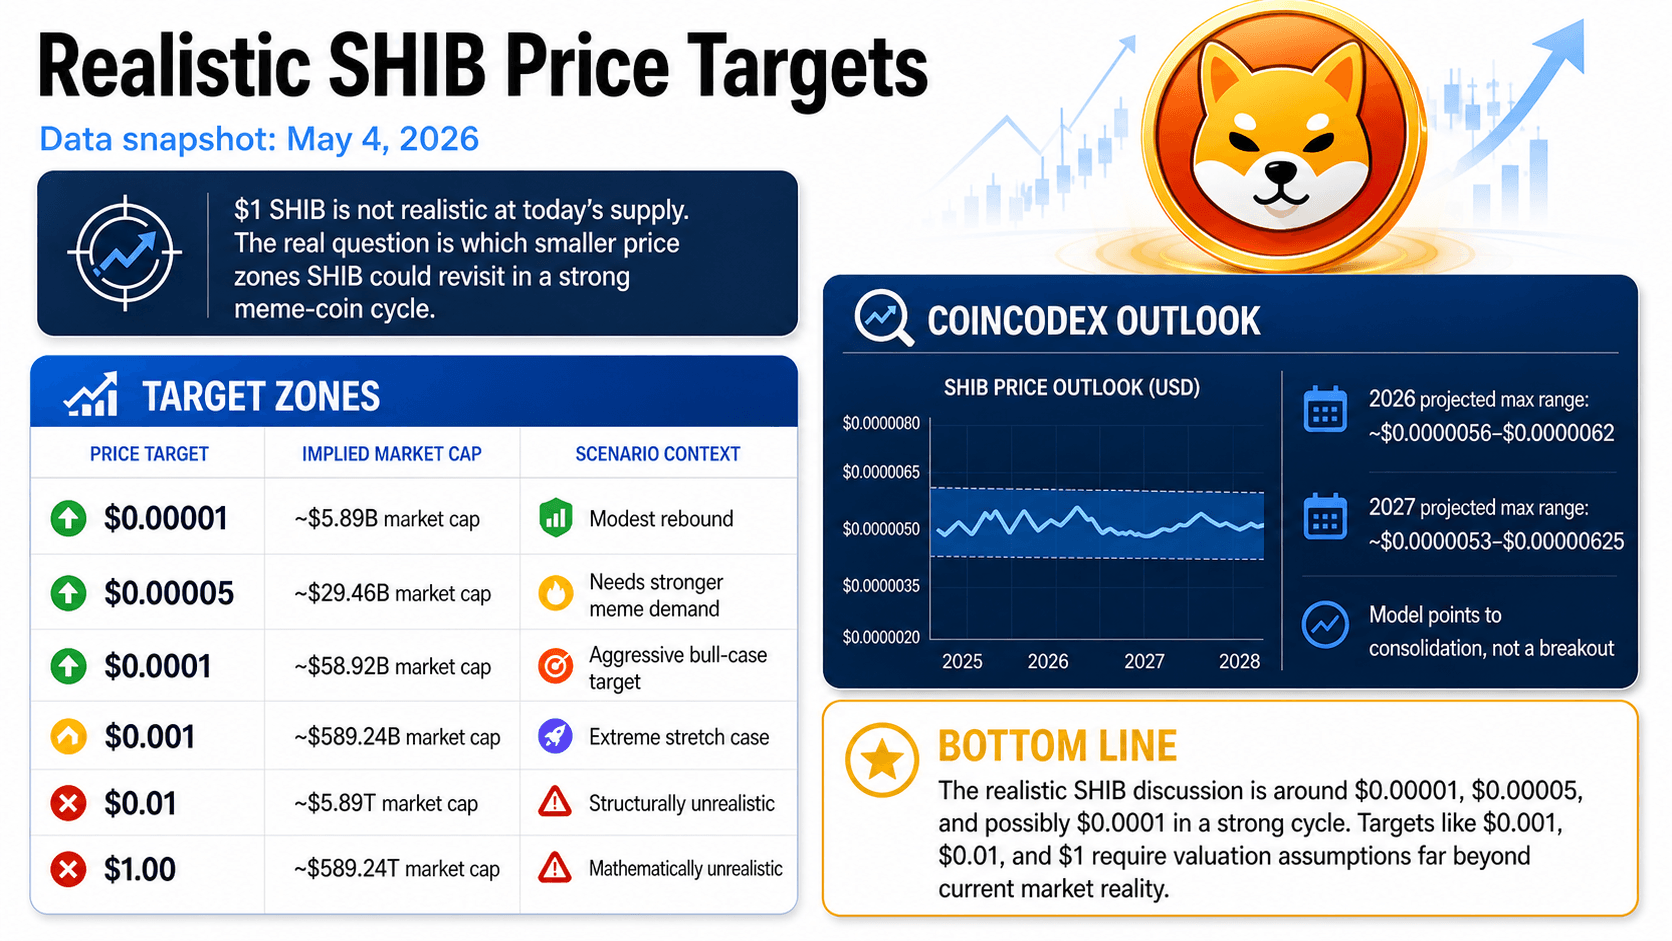
- 2026 outlook: Soft and range-bound, with CoinCodex projecting SHIB mostly between roughly $0.0000051 and $0.0000062 through the end of 2026.
- 2027 outlook: Still subdued, with the model’s highest monthly maximum near $0.000006251 in December 2027.
- 2030 model ceiling: CoinCodex’s current long-range maximum sits near $0.000003533, implying a market cap of about $2.08 billion using 590 trillion SHIB.
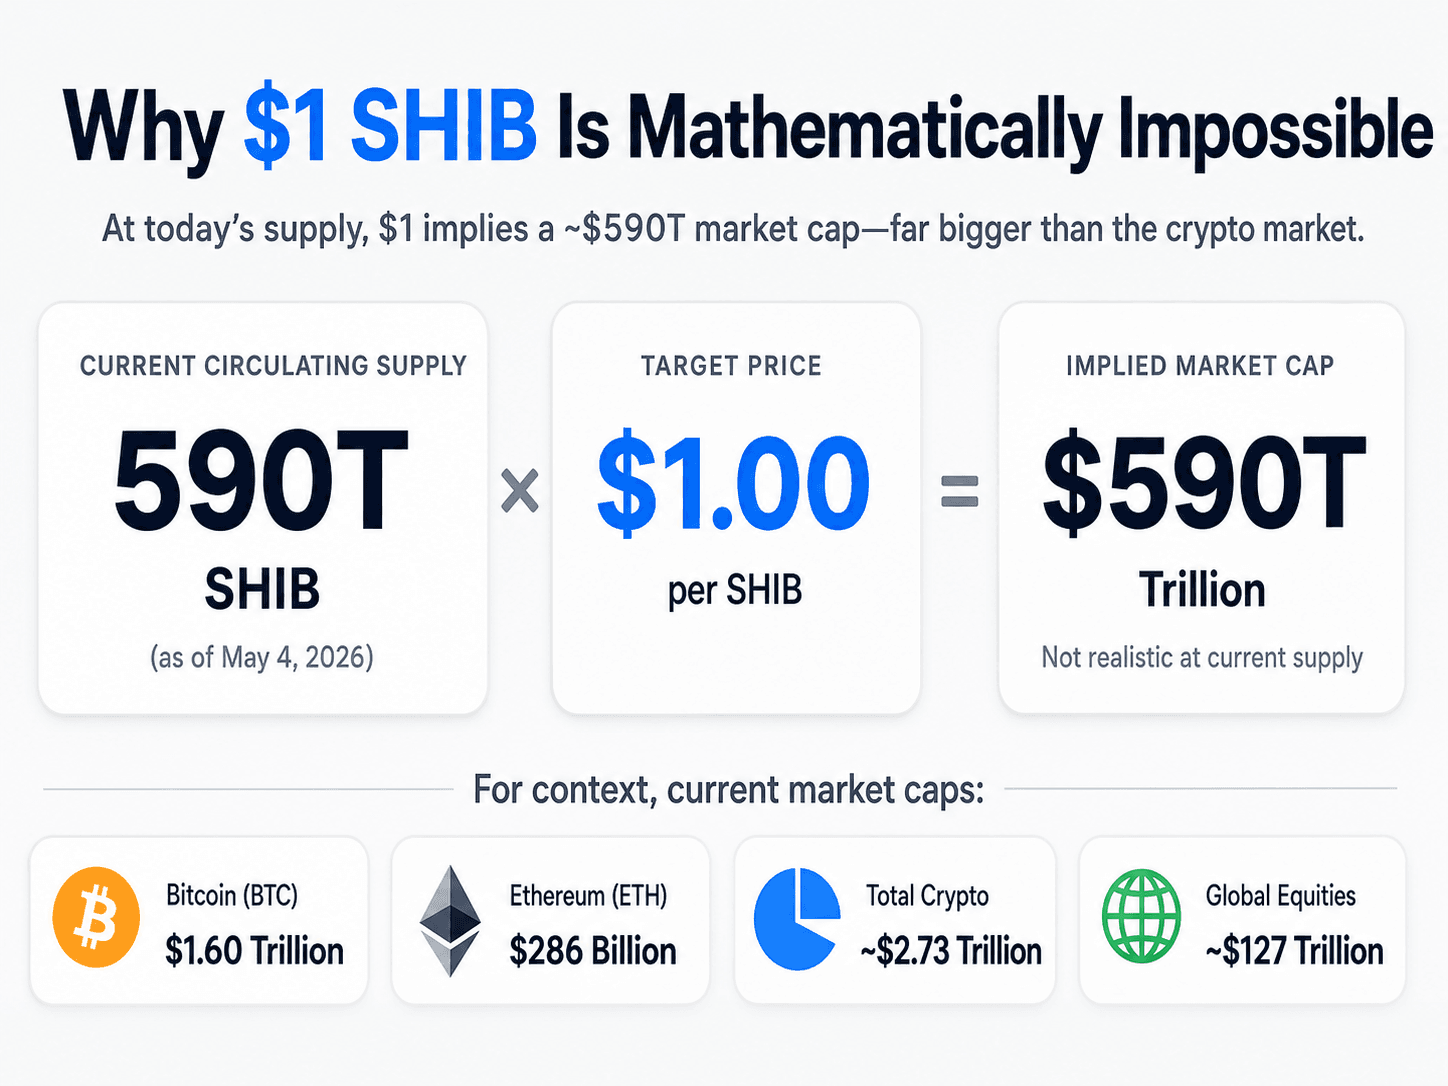
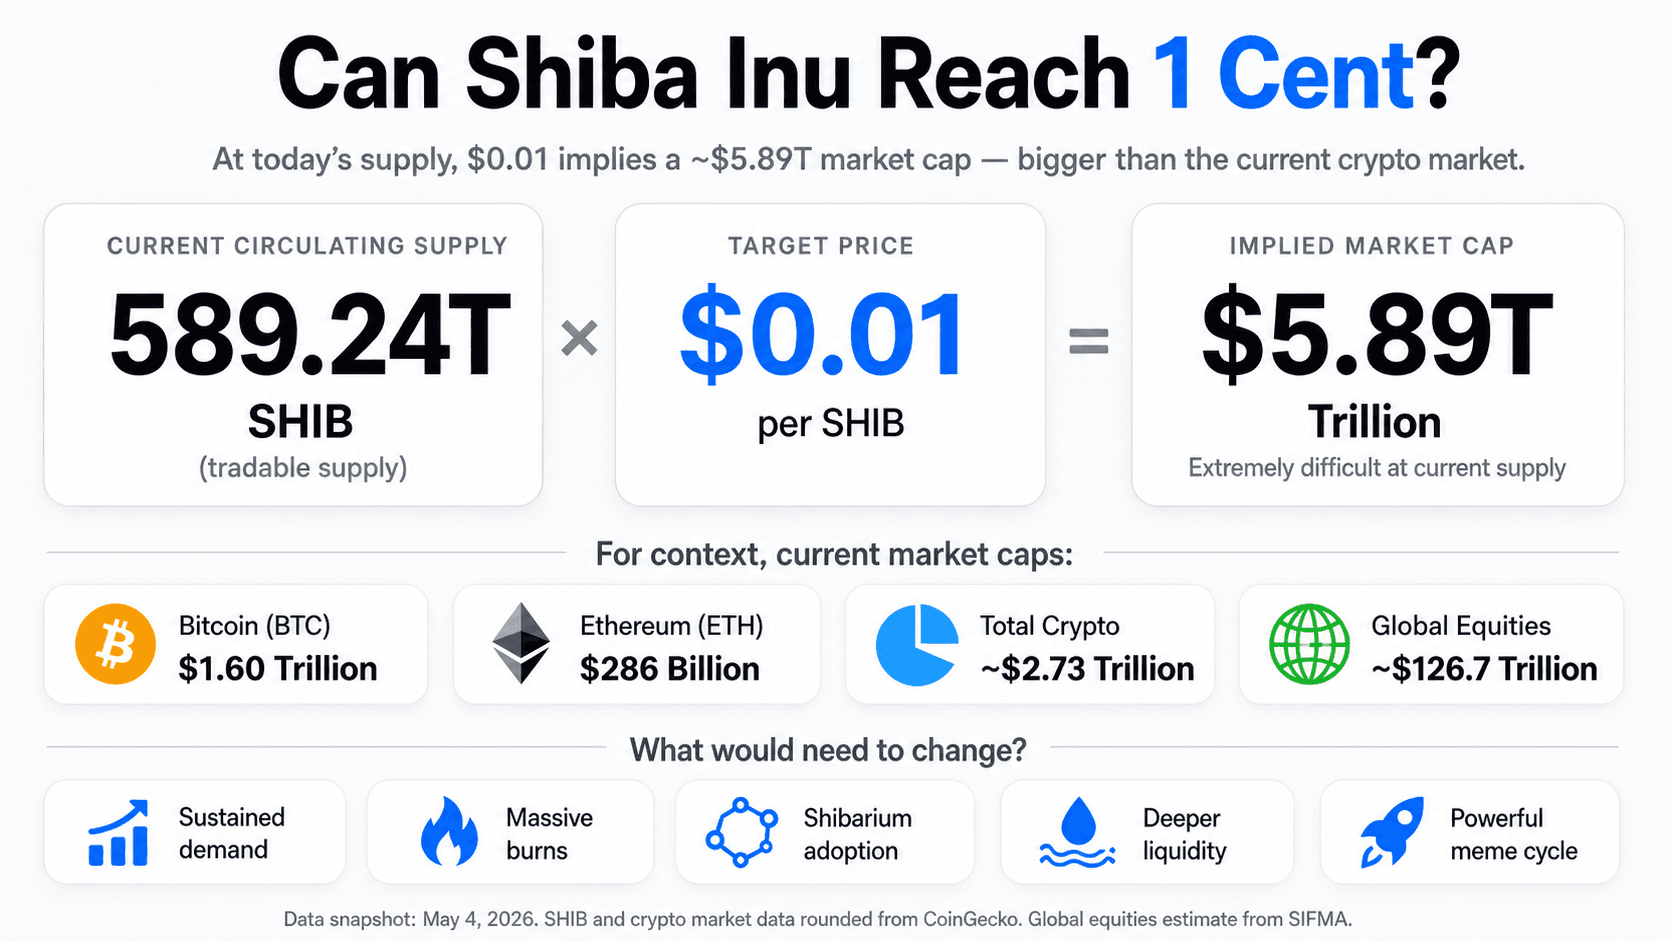
- $1 math: 589.24 T × $1 = $589.24 trillion market cap, which is not a credible outcome at current supply.
- Risk label: Extreme risk, sentiment-driven, and highly sensitive to meme cycles, whale activity, liquidity depth, and social-media momentum.
What could change:
- Massive burns: SHIB would need supply reduction by orders of magnitude, not small recurring burns, for extreme targets like $0.01 or $1 to become mathematically realistic.
- Shibarium adoption: The network would need sustained TVL, fees, DEX volume, active users, and third-party dApps to become a genuine valuation driver.
- Programmatic burn links: Burns would need to be transparent, recurring, and clearly tied to real ecosystem usage rather than one-off community events.
- Liquidity expansion: Stronger order-book depth across major centralized exchanges and deeper DEX liquidity would make larger market caps easier to support.
- Meme-sector revival: A broad return of speculative appetite across meme coins could lift SHIB even without major fundamental improvement.
What to watch:
- Burn pace: Whether monthly and annualized burns rise enough to matter against a supply base measured in hundreds of trillions.
- Shibarium TVL: Whether DeFi liquidity grows from low six figures into meaningful multi-million or higher territory.
- Shibarium fees and revenue: Whether network activity begins producing consistent daily fees and measurable value capture.
- ShibaSwap volume split: Whether trading activity migrates from Ethereum to Shibarium in a meaningful way.
- Holder and whale flows: Whether large holders accumulate, distribute, or create sell-pressure during rallies.
- Market sentiment: Bitcoin trend, meme-coin rotation, exchange volume, social dominance, and broader crypto risk appetite.
Snapshot date: May 4, 2026. Figures reflect SHIB supply, market cap, burn, Shibarium, DefiLlama, Shibburn, CoinGecko, and CoinCodex data available at the time of writing. Always verify live price, supply, burn rate, TVL, and market cap before trading.
Editor’s Note (May 4, 2026): This article was fully updated in May 2026 to reflect SHIB’s latest price, circulating supply, market cap, burn data, Shibarium activity, ShibaSwap volume split, and 2026-2030 forecast ranges. We also rebuilt the $1 SHIB analysis with fresh market-cap math, added a clearer 1-cent SHIB reality check, expanded the Shibarium utility review, and updated the burn section to separate historic supply reductions from the current burn pace. The goal is simple: to show what SHIB would need to achieve higher price targets, what the current data actually supports, and why $1 remains mathematically implausible at today’s supply.
The Mathematical Reality: Why $1 Is Impossible for SHIB
Shiba Inu’s supply base mathematically blocks any realistic path to a $1 valuation. As of May 4, 2026, SHIB trades around $0.0000062 to $0.0000063, with a market cap near $3.7 billion and roughly 589.24 trillion SHIB in circulation. For SHIB to rise from that level to $1, its market cap would need to expand to roughly $589 trillion. That figure is larger than Bitcoin, Ethereum, the entire crypto market, and the global equity market combined several times over.
Let’s break that down through supply and market cap math.
Note: Data as of May 4, 2026.
Supply vs Market Cap
The relationship is simple:
Price × Circulating Supply = Market Cap
That equation is the core reason why the “SHIB to $1” thesis collapses under scrutiny. With roughly 589.24 trillion SHIB in circulation, the math looks like this:
$1 × 589.24 trillion = $589.24 trillion market cap
That would make Shiba Inu worth more than any crypto asset in history. For context, the entire crypto market currently sits around $2.73 trillion, Bitcoin is around $1.60 trillion, and Ethereum is around $286 billion. The global equity market was estimated at $126.7 trillion in SIFMA’s 2025 Capital Markets Fact Book, still far below the valuation SHIB would need to justify a $1 price.
What SHIB Would Be Worth at Popular Price Targets
Assuming roughly 590T SHIB in circulation:
| SHIB Price Target | Implied Market Cap | Reality Check |
|---|---|---|
| $0.0001 | ~$59B | Possible only in a strong meme coin cycle |
| $0.001 | ~$590B | Extreme bull case |
| $0.005 | ~$2.95T | Larger than most major crypto assets have ever reached |
| $0.01 | ~$5.9T | Bigger than the entire crypto market in many historical periods |
| $0.10 | ~$59T | Functionally unrealistic at current supply |
| $1.00 | ~$590T | Mathematically implausible without near-total supply destruction |
This is why $1 SHIB requires a fantasy-level valuation unless the token supply is radically reduced. Even a $1T SHIB market cap, which would be extraordinary for a meme coin, still only puts SHIB around $0.0017 at today’s supply.
What Is Shiba Inu Coin?
Shiba Inu is an ERC-20 meme coin launched on Ethereum in August 2020 by an anonymous creator known as Ryoshi. It began as a community-driven experiment and later expanded into a broader ecosystem that includes SHIB, BONE, LEASH, ShibaSwap, and Shibarium.
SHIB was originally launched with a supply of 1 quadrillion tokens. A large portion of that supply was later removed from circulation after Ethereum co-founder Vitalik Buterin burned roughly 410 trillion SHIB, representing about 41% of the original supply. That burn is the main reason today’s max supply is closer to 590 trillion SHIB, rather than the original 1 quadrillion.
Origins and Background
Shiba Inu became popular because it combined three powerful forces:
- The Dogecoin-inspired meme coin narrative
- Extremely low unit price optics
- A large online community willing to promote the token aggressively
Its early identity was simple: SHIB was the self-styled “Dogecoin killer.” Over time, the project tried to move beyond that label by building an ecosystem around decentralized exchange activity, staking, token burns, NFTs, gaming ideas, and Shibarium.
SHIB Ecosystem and Utility
The Shiba Inu ecosystem is built around several assets and products. The most important are:
- SHIB: The main ERC-20 meme token.
- BONE: The gas and governance-related token used in the Shibarium ecosystem.
- LEASH: A secondary ecosystem token with a smaller supply and more niche use.
- ShibaSwap: The project’s decentralized exchange.
- Shibarium: The Shiba Inu Layer 2 network launched to reduce transaction costs and expand ecosystem activity.
Shibarium is the most important part of the current utility thesis. It went live in August 2023 and was positioned as a Layer 2 network for cheaper transactions, ecosystem apps, and broader SHIB utility.
Historical Price Trends of SHIB
Shiba Inu’s price history follows one clear pattern: SHIB moves with liquidity cycles, exchange access, social attention, whale activity, and meme-coin rotations. It does not trade like a cash-flow asset, and its price has not been driven by protocol revenue or productive on-chain demand in the way a major DeFi token might be.
Since launch, SHIB’s chart has moved through six major phases: early meme accumulation, the 2021 supply burn and breakout, the October 2021 all-time high, the 2022-2023 bear-market reset, the Shibarium utility narrative, and the current 2026 consolidation phase.
| Date / Phase | Event | Why It Mattered |
|---|---|---|
| Aug 2020 | SHIB launched | Ethereum-based meme coin with 1 quadrillion initial supply |
| May 2021 | Vitalik Buterin burned ~410T SHIB | Removed over 40% of original supply and created SHIB’s core burn narrative |
| Oct 2021 | SHIB reached all-time high | Price peaked around $0.00008616 during the meme-coin mania |
| 2022-2023 | Bear market and ecosystem rebuild | SHIB fell with broader crypto and shifted focus to ShibaSwap, BONE, LEASH, burns, and Shibarium |
| Aug 2023 | Shibarium mainnet launched | Added a Layer 2 utility narrative, but economic activity still needed proof |
| May 2026 | Current reset phase | SHIB trades near $0.0000062-$0.0000063, roughly 92% below its ATH |
Launch and Early Meme Accumulation: August 2020 to Early 2021
SHIB launched in August 2020 as an ERC-20 meme token on Ethereum. Its original supply was 1 quadrillion SHIB, an intentionally enormous number that made the unit price look tiny from the beginning. That low unit price became part of the marketing appeal, but it also created the market-cap problem that still limits extreme price targets like $0.01 or $1.
In the earliest phase, SHIB had no serious utility narrative. Its value came from community energy, Dogecoin-style branding, social media attention, and the idea that it could become a lower-priced alternative to DOGE. This was the foundation of the “Dogecoin killer” narrative.
At this stage, SHIB was not being valued on revenue, fees, users, or DeFi traction. It was a pure attention asset. The project’s early growth depended on virality and speculative positioning, not fundamentals.
Vitalik Buterin Burn and 2021 Breakout: May 2021
The most important supply event in SHIB’s history happened in May 2021. Ethereum co-founder Vitalik Buterin had been sent a large portion of SHIB’s supply by the project’s creators. He later burned roughly 410 trillion SHIB, removing more than 40% of the original supply from circulation. He also donated a separate portion of SHIB to charity.
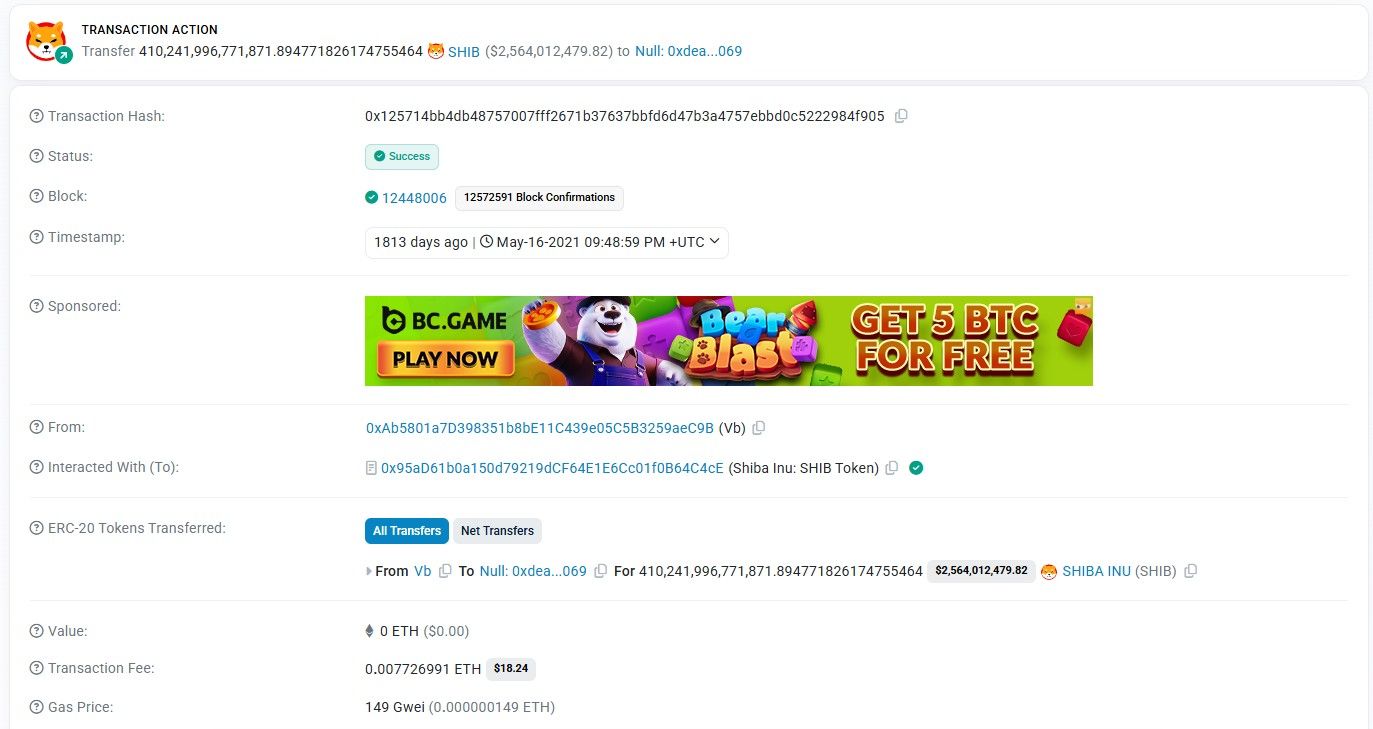 Ethereum's Vitalkik Buterin Burned $6 Billion Worth of SHIB. Image via Etherscan
The burn permanently reduced the available supply from the original 1 quadrillion base and it gave SHIB a scarcity narrative. This was also the period when SHIB moved from a fringe meme token into the broader retail-trading conversation.
All-Time High: October 2021
SHIB’s peak came during the 2021 meme-coin frenzy. CoinGecko lists Shiba Inu’s all-time high at $0.00008616, reached on Oct. 28, 2021. At current prices, SHIB remains roughly 92%-93% below that all-time high.
This was the defining SHIB cycle. The rally was powered by:
- Meme-coin speculation
- Major exchange access
- Whale flows
- Retail buying
- Social media momentum
- Broader crypto-market liquidity
- The burn narrative created earlier in 2021
The all-time high also shows why SHIB can still rally hard in the right market. But it also shows the ceiling problem. Even at its peak, SHIB remained nowhere near $0.001, $0.01, or $1.
Bear Market and Ecosystem Rebuild: 2022 to 2023
After the 2021 cycle ended, SHIB followed the broader crypto market lower. Like most meme coins, it suffered when liquidity left high-risk assets. The token’s price action became less about breakout momentum and more about survival, community retention, and ecosystem development.
During this period, the Shiba Inu project leaned harder into the idea that SHIB could become more than a meme coin. The ecosystem narrative expanded around:
- ShibaSwap
- BONE
- LEASH
- Token burns
- NFT-related activity
- Gaming and metaverse ideas
- Shibarium
This phase was important because it tried to give SHIB a utility story. But from a valuation perspective, the market still needed hard evidence: fees, TVL, DEX volume, active users, sticky applications, and meaningful burn activity.
Shibarium Launch and Utility Narrative: August 2023
Shibarium launched in August 2023 as the Shiba Inu ecosystem’s Ethereum Layer 2 network. Its purpose was to support cheaper transactions, ecosystem applications, and a more scalable foundation for SHIB-related activity.
The launch gave SHIB holders a new narrative: More Shibarium usage → more gas activity → more ecosystem fees → more burns → stronger SHIB valuation story.
2026 Cycle and Current Phase
As of May 2026, SHIB trades around $0.0000062 to $0.0000063, with a market cap in the $3.6 billion to $3.7 billion range.
That leaves SHIB roughly 92% below its October 2021 all-time high. The current price action does not show the same speculative intensity as 2021.
Could Burns Make $1 SHIB Possible?
Burns are the most common argument for a higher SHIB price. The idea is simple: if enough tokens are permanently removed from circulation, each remaining token could become more valuable.
While the theory is true, the problem is scale.
SHIB does not need small burns to reach $1. It would need one of the largest supply reductions in crypto history, sustained over time and paired with real demand.
How SHIB Burns Work
A token burn sends SHIB to a wallet that no one can access, often called a dead wallet or burn address. Once tokens are sent there, they are effectively removed from circulating supply.
SHIB burns generally come from three sources:
- Community burns: Voluntary burns by holders or community projects.
- Ecosystem burns: Burns linked to products, campaigns, or fees.
- Shibarium-related burns: Burns tied to activity on Shibarium, where BONE is used for gas and burn mechanisms are intended to connect ecosystem usage with SHIB supply reduction.
The strongest burns are not one-off stunts. They are programmatic, transparent, frequent, and funded by real usage. A burn headline may sound impressive, but burning billions of SHIB barely moves the needle when supply is measured in hundreds of trillions.
How Much SHIB Would Need to Be Burned?
For SHIB to reach $1 at different valuation levels, supply would need to shrink dramatically.
| Assumed SHIB Market Cap | Supply Needed for $1 SHIB | Approx. Supply Reduction Needed |
|---|---|---|
| $10B | 10B SHIB | Nearly all current supply |
| $50B | 50B SHIB | Nearly all current supply |
| $100B | 100B SHIB | Nearly all current supply |
| $500B | 500B SHIB | More than 99.9% of supply |
| $1T | 1T SHIB | More than 99% of supply |
Even if SHIB somehow became a $500B asset, which would be a massive valuation for a meme coin, the supply would still need to fall from roughly 590T to around 500B for a $1 price to make sense.
That is the central problem. Burns do not just need to increase. They need to increase by orders of magnitude.
Current Burn Pace vs Required Burn Pace
The burn narrative becomes much clearer when you compare today’s actual burn rate with the burn rate required to move SHIB toward major price targets.
Note: Data as of May 4, 2026, via Shibburn
| Metric | SHIB Amount | USD Value |
|---|---|---|
| Total burned | 410,839,952,737,308 SHIB | ~$7.36B |
| Last 24 hours burned | 4,636,454 SHIB | ~$28 |
| Last 7 days burned | 51,763,051 SHIB | ~$308 |
| Last 30 days burned | 230,291,476 SHIB | ~$1,370 |
The headline number looks huge: more than 410.8 trillion SHIB have been burned in total. But most of that reduction is already in the past. The number that matters for future price impact is the current burn pace, and that pace is very small relative to the remaining supply.
Over the last 30 days, about 230.3 million SHIB were burned. Against a circulating supply of roughly 585.4 trillion SHIB, that equals only about 0.000039% of circulating supply in 30 days
Annualized, that pace is roughly 2.8 billion SHIB per year. That sounds large in normal terms, but against a supply base of 590trillion, it is tiny. At the current 30-day burn pace, SHIB is burning only about 0.00048% of circulating supply per year.
Required Burn Pace for Major Targets
If SHIB’s market cap stayed around today’s level and price appreciation came mainly from supply reduction, the required burns would be enormous.
| Target Price | What Needs to Happen |
|---|---|
| $0.0001 | Supply would need to fall dramatically, or SHIB would need a much larger market cap |
| $0.001 | Requires massive demand growth plus meaningful supply reduction |
| $0.01 | Requires a huge supply collapse, a historic valuation re-rating, or both |
| $1 | Requires near-total supply destruction or an impossible market cap |
Burns would need to reduce supply by more than 99.9% before $1 could even begin to fit inside a remotely plausible valuation range.
Can Shiba Inu Reach 1 Cent Instead?
At roughly 590T SHIB in circulation, a $0.01 price would imply a market cap of about $5.9 trillion. That is bigger than the entire crypto market has been for most of its history.
Why 1 Cent SHIB Is Still Extremely Difficult
SHIB reaching $0.01 would require one or more of the following:
- A huge crypto bull market
- A major meme coin rotation
- Massive new demand for SHIB
- A dramatic reduction in circulating supply
- Shibarium becoming a meaningful fee-generating ecosystem
- Deep liquidity across major centralized and decentralized exchanges
The issue is not whether SHIB can move, but whether it can sustain a multi-trillion-dollar valuation. That is a much higher bar.
What Would Need to Happen for 1 Cent SHIB?
For SHIB to make a serious run toward 1 cent, five things would need to change:
- Sustained demand: SHIB would need buyers beyond short-term meme speculation.
- Massive burns: Supply would need to fall meaningfully, not cosmetically.
- Shibarium adoption: The network would need real fees, users, TVL, and dApps.
- Deeper liquidity: Large orders would need to move through exchanges without major slippage.
- A powerful meme cycle: SHIB would need broad crypto risk appetite and renewed attention.
A more realistic framework is to watch whether SHIB can regain stronger meme-sector momentum and move toward smaller milestones first, such as $0.0001 or $0.001 under favorable conditions.
Shibarium Reality Check: Does Utility Support the Price?
Shibarium is the strongest utility argument for SHIB. It is also where the numbers need to be checked most carefully.
The bullish claim is that Shibarium can create real usage, generate fees, support ecosystem applications, and feed burn mechanisms. The bearish reality is that current public DeFi metrics remain very small.
Note: Data as of May 4, 2026, via DefiLlama, Shibarium Scan
| Metric | Current Snapshot | Why It Matters |
|---|---|---|
| Shibarium DeFi TVL | ~$196,096 | This shows very little capital is currently locked in Shibarium DeFi. A useful SHIB burn-and-utility thesis needs TVL to grow meaningfully, not remain in the low six figures. |
| Daily transactions | ~3,010 transactions/day | Transactions show network activity, but they are not enough on their own. They need to translate into fees, DEX volume, TVL, and burns. Shibarium also saw a recent drop from 3,010 transactions on April 30 to 1,240 on May 2, showing activity remains choppy. |
| Total transactions | 1,561,196,517 total transactions | This shows Shibarium has processed a large cumulative number of transactions since launch, but cumulative transactions should not be confused with current economic demand. |
| Wallet addresses | 269,795,905 wallet addresses | This shows broad address creation, but it does not equal daily active users. For price impact, active users and repeat economic activity matter more than cumulative address count. |
| Chain fees | $0 in 24 hours | Fees are the cleanest signal of economic demand. If fees are near zero, Shibarium is not currently generating enough fee activity to support meaningful usage-funded burns. |
| Chain revenue | $0 in 24 hours | Revenue shows whether network activity is translating into value capture. At the current snapshot, revenue is not supporting the bullish utility thesis. |
| Shibarium DEX volume | ~$1 in 24-hour DEX volume; ~$3 over 7 days | DEX volume shows whether users are actually trading on Shibarium. Current volume is negligible, which means Shibarium is not yet functioning as a meaningful liquidity hub for SHIB. |
| ShibaSwap volume on Shibarium | ~$1 in 24h volume, ~$3 in 7d volume, ~$9,209 in 30d volume | This is important because ShibaSwap is supposed to be a core ecosystem venue. Current data shows almost all ShibaSwap volume remains on Ethereum, not Shibarium. |
| ShibaSwap volume on Ethereum | ~$43,610 in 24h volume, ~$567,640 in 7d volume, ~$15.33M in 30d volume | This shows that ShibaSwap’s real trading activity is still concentrated on Ethereum. Shibarium has not yet become the main liquidity layer for the SHIB ecosystem. |
| Burn transactions | 20,773 total burn transactions | Burn transaction count shows that burns are happening, but the count matters less than the amount burned and whether burns are recurring, programmatic, and tied to real usage. |
What the data says: Shibarium has large cumulative transaction and wallet-address numbers, but the economic metrics that matter most for SHIB’s valuation are currently weak. TVL is below $200,000, 24-hour fees are $0, 24-hour DEX volume is about $1. That means Shibarium is not yet producing the kind of fee activity, liquidity depth, or usage-funded burns needed to materially support a higher SHIB valuation.
ShibaSwap Activity Is Still Mostly on Ethereum
ShibaSwap is another useful reality check because it shows where actual ecosystem trading is happening. DefiLlama currently shows Shibarium DeFi TVL at about $196,096, with $0 in 24-hour chain fees, $0 in 24-hour chain revenue, about $1 in 24-hour DEX volume, and about $3 in 7-day DEX volume. Those figures show that Shibarium is not currently generating meaningful DeFi liquidity, fee activity, or trading volume.
The ShibaSwap split tells the same story. DefiLlama shows about $15.34 million in ShibaSwap 30-day DEX volume, with roughly $15.33 million on Ethereum and only about $9,209 on Shibarium. Over the last 7 days, ShibaSwap processed about $567,643 in DEX volume, with roughly $567,640 on Ethereum and only $3 on Shibarium. Over the last 24 hours, ShibaSwap processed about $43,611, with roughly $43,610 on Ethereum and about $1 on Shibarium.
Shibarium is supposed to be the SHIB ecosystem’s utility layer. If ShibaSwap activity is still overwhelmingly concentrated on Ethereum, then Shibarium has not yet become the main liquidity engine for the Shiba Inu ecosystem.
In plain English: Shibarium has a narrative role, but the current economic activity is still extremely thin. The network needs sustained liquidity, fees, and trading activity before it can be treated as a serious valuation driver for SHIB.
What Would Count as Real Progress?
For Shibarium to matter to SHIB’s valuation, the following metrics need to improve in a measurable way:
| Metric | What Real Progress Would Look Like |
|---|---|
| Shibarium DeFi TVL | TVL rising into the tens or hundreds of millions and staying there across multiple quarters |
| Shibarium chain fees | Consistent daily fees that show real economic demand |
| Shibarium chain revenue | Revenue or fee capture that supports ecosystem value accrual |
| Shibarium DEX volume | Daily DEX volume growing into meaningful six- or seven-figure territory |
| ShibaSwap 30d volume on Shibarium | ShibaSwap volume migrating meaningfully from Ethereum to Shibarium |
| ShibaSwap 30d volume on Ethereum | Ethereum no longer accounting for nearly all ShibaSwap trading activity |
| Burn link to usage | Programmatic burns clearly linked to fees, with public reconciliation from fees to burn transactions |
| Third-party DApps | More DApps launching, retaining users, and adding TVL beyond ShibaSwap |
| Bridge liquidity | Assets bridging into Shibarium and remaining there as TVL, liquidity, or productive DeFi activity |
Shibarium needs to show rising TVL, consistent DEX volume, real fees, sticky DApps, and transparent usage-linked burns. Until those numbers improve, Shibarium remains a narrative catalyst, not a proven valuation engine for SHIB.
Realistic Price Targets: What SHIB Can Achieve
The $1 target fails on market-cap math, but that does not mean SHIB has no upside.
CoinCodex’s forecast as of May 4, 2026, is cautious. The model does not show SHIB entering a breakout phase in 2026 or 2027. Instead, it keeps SHIB mostly in the $0.000005 to $0.000006 range, which suggests sideways trading rather than a serious move toward deleting another zero.
Short-Term Outlook (Next 6–12 Months)
CoinCodex’s 2026 projections show SHIB struggling to build momentum. The model’s monthly maximum prices stay close to current levels, with several months showing negative projected performance.
| Month | Min. Price | Avg. Price | Max. Price |
|---|---|---|---|
| May 2026 | $0.000005571 | $0.000006003 | $0.000006235 |
| June 2026 | $0.000005364 | $0.000005644 | $0.000005936 |
| July 2026 | $0.000005711 | $0.000005861 | $0.000006135 |
| August 2026 | $0.000005547 | $0.000005707 | $0.000006085 |
| September 2026 | $0.000005088 | $0.000005340 | $0.000005615 |
| October 2026 | $0.000005346 | $0.000005504 | $0.000005709 |
| November 2026 | $0.000005738 | $0.000006073 | $0.000006190 |
| December 2026 | $0.000005715 | $0.000005917 | $0.000006115 |
The model’s message is fairly blunt: SHIB remains tradeable, but the forecast does not price in a major speculative expansion through the end of 2026.
A reasonable interpretation of the 2026 range is:
- Support area: Around $0.0000051 to $0.0000054
- Resistance area: Around $0.0000061 to $0.0000062
- Main driver: Broader crypto liquidity and meme-coin appetite, not current Shibarium utility
That does not mean SHIB cannot outperform the model. Meme coins can move violently when sentiment changes. But based on this forecast, the base case is consolidation, not a clean zero-removal rally.
SHIB 2027 Forecast: Still No Major Breakout
The 2027 forecast also stays contained. CoinCodex projects SHIB mostly within the same broad range, with the highest monthly maximum reaching about $0.000006251 in December 2027.
| Month | Min. Price | Avg. Price | Max. Price |
|---|---|---|---|
| January 2027 | $0.000005623 | $0.000005815 | $0.000006013 |
| February 2027 | $0.000005377 | $0.000005701 | $0.000005983 |
| March 2027 | $0.000004883 | $0.000005241 | $0.000005521 |
| April 2027 | $0.000005049 | $0.000005216 | $0.000005306 |
| May 2027 | $0.000005165 | $0.000005316 | $0.000005550 |
| June 2027 | $0.000005614 | $0.000006018 | $0.000006189 |
| July 2027 | $0.000005462 | $0.000005745 | $0.000006250 |
| August 2027 | $0.000005531 | $0.000005906 | $0.000006208 |
| September 2027 | $0.000005604 | $0.000005815 | $0.000006165 |
| October 2027 | $0.000005576 | $0.000005722 | $0.000005967 |
| November 2027 | $0.000005518 | $0.000005581 | $0.000005643 |
| December 2027 | $0.000005606 | $0.000005922 | $0.000006251 |
This is not a bullish forecast. It does not show SHIB moving toward $0.0001, $0.001, or $0.01 in the 2026 to 2027 window. It shows a token that remains liquid but lacks the modeled momentum needed for a major repricing.
The practical takeaway is simple: Shiba Inu coin's near-term upside is capped unless market conditions change meaningfully.
Why $0.001 Is a Stretch Target
A price of $0.001 would value SHIB at roughly $589 billion using today’s supply. That would place SHIB near the highest tier of crypto valuations, despite the fact that current Shibarium DeFi activity, fees, DEX volume, and usage-linked burn activity remain weak.
For SHIB to justify that kind of valuation, the market would need to see more than social momentum. It would need:
- A major return of global speculative liquidity
- Meme coins being treated as durable large-cap assets, not just cycle trades
- Shibarium becoming economically meaningful
- Programmatic burns large enough to affect supply
- Deeper liquidity across centralized and decentralized markets
- A much stronger reason to hold SHIB beyond community identity
At today’s approximate $3.7 billion market cap, reaching $0.001 would require around a 160x expansion. That is possible only as an extreme outcome, not as a reasonable base case.
Why 1 Cent SHIB Is Even Harder
A move to $0.01 would push SHIB’s implied market cap to roughly $5.89 trillion. That is larger than the current total crypto market.
This is where the 1 cent target breaks down. SHIB would need either a dramatic supply reduction, a massive expansion of the crypto market, or both. Current burn rates and Shibarium activity do not support that outcome.
So the realistic SHIB price conversation should stay focused on:
- $0.00001 as a modest recovery level
- $0.00005 as a stronger meme-cycle target
- $0.0001 as an aggressive bull-case target
By contrast, $0.001 is a stretch case, $0.01 is structurally unrealistic without major supply reduction, and $1 SHIB is not a credible target at current supply.

SHIB Price Predictions 2026-2030: Yearly Tables
| Year | Minimum Price | Average Price | Maximum Price | Implied Market Cap at Max |
|---|---|---|---|---|
| 2026 | $0.00000509 | $0.00000576 | $0.000006235 | $3.67B |
| 2027 | $0.00000488 | $0.00000567 | $0.000006251 | $3.68B |
| 2028 | $0.00000335 | $0.00000454 | $0.000006075 | $3.58B |
| 2029 | $0.00000254 | $0.00000319 | $0.000004227 | $2.49B |
| 2030 | $0.00000275 | $0.00000309 | $0.000003533 | $2.08B |
Forecasts: CoinCodex, retrieved May 4, 2026. Not financial advice; models can be wrong and may change.
Note: 2026 figures summarize the May-December 2026 monthly forecast data provided. Implied market caps are calculated using 589.24 trillion SHIB in circulating supply.