Bitcoin’s price history looks erratic day to day, but over longer horizons it has followed a surprisingly consistent growth path. Cycles of accumulation, expansion, and excess have repeated even as market structure evolved from retail speculation to institutional participation.
The Bitcoin Rainbow Chart exists to put today’s price into that long-term context. By mapping Bitcoin’s full history onto a logarithmic growth curve and sentiment bands, it helps investors assess whether the price is historically stretched, compressed, or behaving normally for its phase in the cycle.
This guide treats the Rainbow Chart as a context tool, not a forecasting model. It explains how the chart works, where it has held up and broken down, and how to interpret its signals responsibly, starting with the most practical question: where Bitcoin sits on the Rainbow Chart right now.
Quick Answer: What Is the Bitcoin Rainbow Chart?
The Bitcoin Rainbow Chart is a long-term valuation map that places Bitcoin’s price on a logarithmic regression trendline and wraps it with colored bands that represent historical “too cold / too hot” zones. It helps you interpret where price sits relative to Bitcoin’s long-run growth curve across cycles, not day-to-day noise.
Colors, in one line: cooler blues have historically aligned with undervaluation and accumulation, while warmer yellows/oranges/reds have aligned with overextension and distribution risk.
What it does not do: it doesn’t predict exact prices or dates (it’s a probabilistic context tool, not a price target generator).

Glossary
Before going deeper, it helps to lock in the terminology used throughout this guide. The Rainbow Chart blends market structure, statistics, and investor behavior, so these definitions are meant to ground the analysis and keep interpretations consistent.
- Logarithmic Scale: A chart scale that shows percentage growth evenly, so exponential moves appear comparable across time. This prevents early price moves from visually dominating later cycles when Bitcoin trades at much higher prices.
- Logarithmic Regression: A statistical trendline fitted on log-scaled data to model long-term exponential growth with diminishing returns. It smooths Bitcoin’s volatility into a structural growth curve rather than reacting to short-term noise.
- Regression Curve: The central trendline that approximates Bitcoin’s long-term price trajectory based on historical data. Rainbow bands are built as deviations around this curve, not independent signals.
- Deviation Bands: Fixed percentage multiples above and below a regression curve used to classify overvaluation and undervaluation. They translate abstract price distance into intuitive cycle zones like accumulation or excess.
- Accumulation Phase: A market period where price stabilizes after a drawdown and long-term investors gradually build positions. This phase often feels uneventful but historically precedes multi-year advances.
- Distribution Phase: A late-cycle phase where large holders reduce exposure as price becomes historically extended. Retail participation usually peaks here, even as long-term risk increases.
- Cycle Top: A market peak marked by extreme valuation, euphoric sentiment, and elevated risk of reversal. These tops are often confirmed only after price momentum has already weakened.
- Cycle Bottom: A market low formed after capitulation, where selling pressure is exhausted and value asymmetry emerges. Bottoms tend to form quietly, long before sentiment turns positive.
- Diminishing Returns: The tendency for Bitcoin’s cycle gains to shrink over time as market capitalization grows. This explains why later cycles produce lower multiples despite higher absolute prices.
- Power-Law Growth: A growth pattern where returns decline predictably as an asset matures, common in network-driven adoption curves. The Rainbow Chart implicitly assumes Bitcoin follows this long-term adoption behavior.
- Overextension: A condition where price trades far above its historical trend, increasing downside risk. Overextension does not guarantee an immediate top, but it raises the cost of being wrong.
- Underextension: A condition where price trades well below its historical trend, often coinciding with capitulation. These zones historically offered the most favorable risk-reward for long-term buyers.
- Probabilistic Model: A framework that describes likelihoods and historical tendencies rather than predicting exact outcomes. The Rainbow Chart ranks risk context, not future price targets.
- Time-Based Regression: A model anchored to elapsed time since Bitcoin’s genesis block, rather than discrete events like halvings. This treats Bitcoin’s maturity as a continuous process instead of stepwise cycles.
- Halving-Anchored Regression: A regression model that aligns trend calculations to Bitcoin’s four-year supply reduction cycles. It emphasizes supply shocks but can diverge when demand or macro forces dominate.
- Weekly Close: The final price of an asset at the end of the weekly trading session, often used for cycle analysis. Weekly closes reduce noise and better reflect structural market positioning.
- Sentiment Indicator: A tool that reflects market psychology and positioning rather than direct supply-demand mechanics. The Rainbow Chart encodes sentiment visually through color rather than raw data.
- Structural Trend: The dominant long-term direction of price shaped by adoption, liquidity, and market maturity. Short-term volatility often obscures this trend, which the Rainbow Chart attempts to isolate.
- Regime Shift: A fundamental change in market behavior caused by macro forces, policy changes, or new participants. Examples include ETF-driven demand or aggressive global tightening cycles.
- Black Swan Event: An unpredictable, high-impact event that invalidates historical models in the short term. Exchange collapses and global crises often push price outside Rainbow bands temporarily.
- Cycle Normalization: The process of viewing price action relative to historical cycles rather than absolute price levels. This helps investors avoid anchoring to prior highs or recent drawdowns.
- DCA (Dollar-Cost Averaging): An investment strategy where fixed amounts are deployed at regular intervals regardless of price. Rainbow bands can be used to modulate DCA intensity rather than timing entries.
- Risk-Off Environment: A market phase where participants reduce exposure to volatile assets in favor of capital preservation. During risk-off periods, Rainbow signals can lag as liquidity dries up.
- Overfitting: When a model is tuned too closely to past data, reducing its reliability in future conditions. Frequent Rainbow recalibrations reflect attempts to balance fit without breaking structure.
Bitcoin Rainbow Chart Color Bands Explained
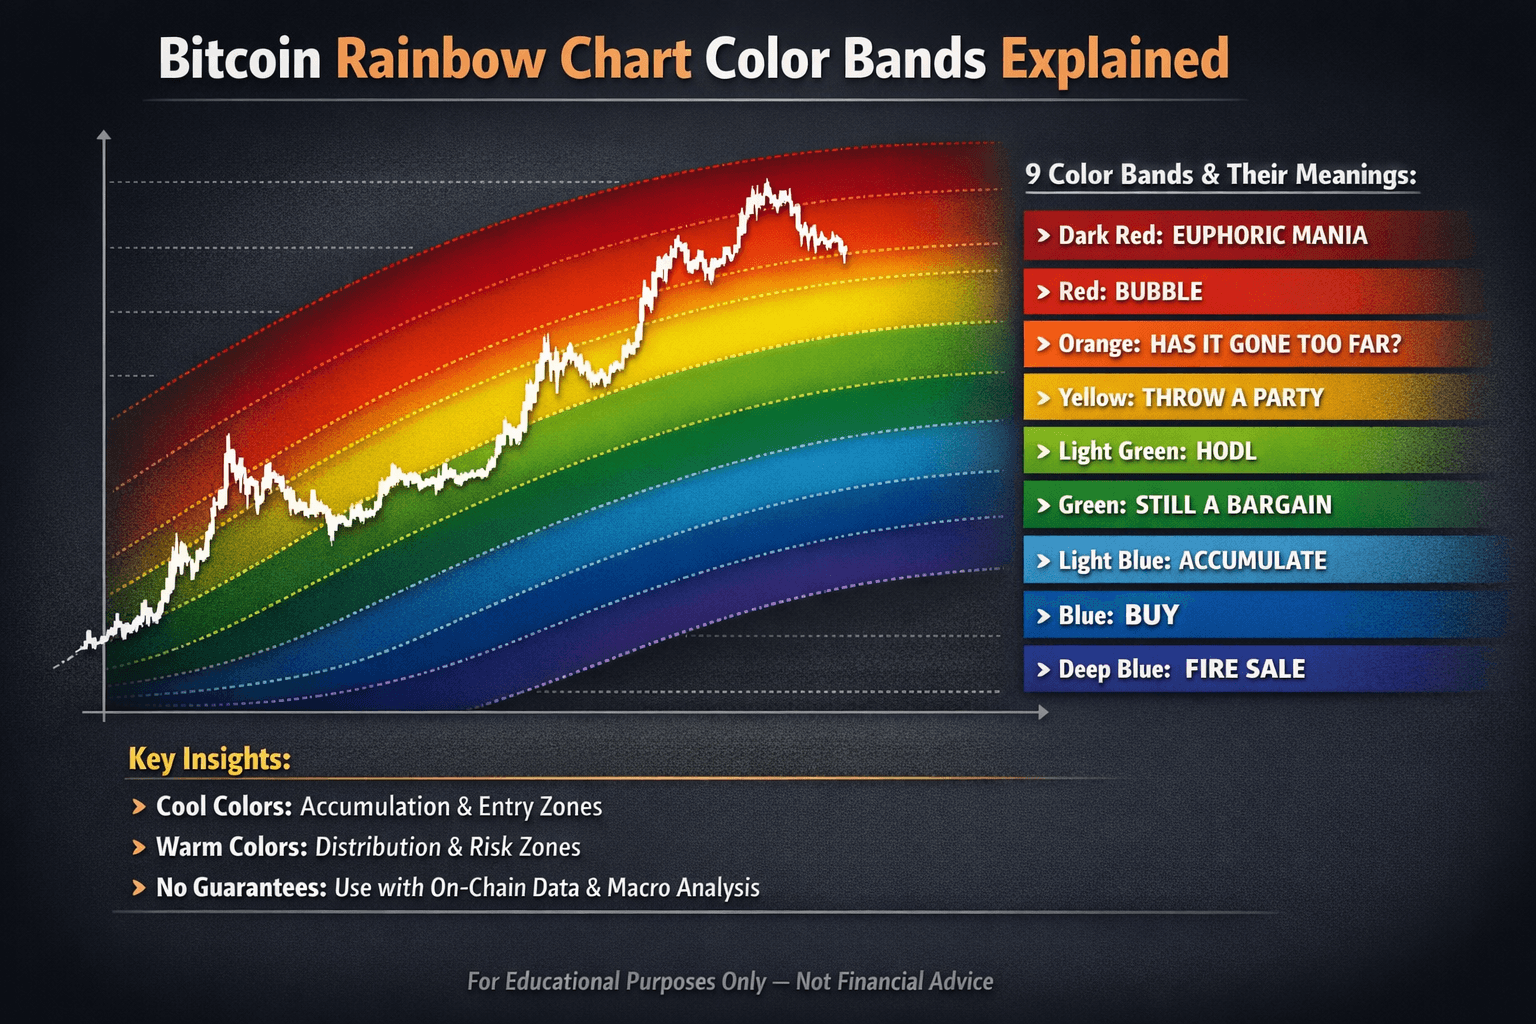
The Rainbow Chart’s nine color bands translate Bitcoin’s deviation from its log-scale regression curve into probabilistic market regimes. Cooler bands have historically aligned with accumulation and long-term entry phases, while warmer bands have aligned with distribution and risk management zones.
These bands describe historical behavior, not guarantees. Macro shifts, halving cadence, and liquidity cycles can override prior patterns. The chart works best as a contextual layer alongside on-chain data, macro signals, and position sizing discipline, not as a standalone trigger.
 Meaning Behind Each Color Band In Bitcoin Rainbow Chart
Full Color Band Breakdown With Typical Behavior
Each color band reflects a different phase of the Bitcoin cycle (data for examples), mapping price relative to its long-term trend and the behavior it tends to trigger. Reading the chart correctly means understanding what typically happens inside each zone, not reacting to the color alone.
Deep Blue — “FIRE SALE”
- Position: Extreme undervaluation, well below trend. Historically appears after 70–85% drawdowns
- Examples: 2015 near $200, 2018 near $3,200
- Typical investor behavior: Panic selling, capitulation headlines, institutions disengage
- What experienced investors do: Build positions aggressively and early, accepting volatility as cycles reset
- Common mistakes: Waiting for one more collapse, fleeing to cash equivalents instead of deploying
Blue — “BUY”
- Position: Early recovery, still below trend
- Examples: 2019, basing around $4,000–$6,000
- Typical investor behavior: Tentative dip buying mixed with disbelief
- What experienced investors do: Scale in deliberately, begin structured DCA if not already active
- Common mistakes: Chasing fast bounces without position sizing or downside planning
Light Blue — “ACCUMULATE”
- Position: Near trendline, post-capitulation or post-halving digestion
Context: Often aligns with mid-bear recoveries or early cycle rebuilds - Typical investor behavior: Slow accumulation, testing conviction
- What experienced investors do: Build core exposure, add around long-term moving averages
- Common mistakes: Overcommitting too early and ignoring early exit signals or on-chain flows
Green — “STILL A BARGAIN”
- Position: Slightly above trend, bull market base forming
- Examples: 2020 near $10,000
- Typical investor behavior: Retail returns, first real profits taken
- What experienced investors do: Add selectively, monitor valuation metrics like MVRV for excess
- Common mistakes: Introducing leverage during consolidation phases
Light Green — “HODL”
- Position: Acceleration phase, momentum builds
- Context: Cycle legs ignite, resistance zones approach
- Typical investor behavior: FOMO increases, social conviction spikes
- What experienced investors do: Trail stops, take partial profits into strength
- Common mistakes: Going all-in on parabolic candles or rotating blindly into high-beta alts
Yellow — “THROW A PARTY” (Market Top Risk)
- Position: Euphoric extension above trend
- Context: Late-cycle acceleration, parabolic price action
- Typical investor behavior: Maximum leverage, mainstream participation, peak narrative confidence
- What experienced investors do: De-risk aggressively, rotate into cash or stable exposure
- Common mistakes: Believing the cycle has structurally changed and doubling down
Orange — “HAS IT GONE TOO FAR?”
- Position: Bubble warning zone
- Examples: 2021 above $60,000
- Typical investor behavior: Denial rallies, repeated dip buying fails
- What experienced investors do: Exit fully or hedge heavily, watch multiples like Puell >10
- Common mistakes: Averaging down into a clear distribution
Red — “BUBBLE”
- Position: Peak insanity, extreme deviation from trend
- Examples: Final blow-off tops
- Typical investor behavior: 24/7 price obsession, late entrants dominate
- What experienced investors do: Stay flat or positioned defensively, prepare for deep retraces
- Common mistakes: Margin calls, revenge trading after the reversal
Dark Red — “EUPHORIC MANIA”
- Position: Absolute extreme, blow-off phase
- Context: Terminal price exhaustion
- Typical investor behavior: Total FOMO, no risk control, belief that selling is irrational
- What experienced investors do: Zero spot exposure, macro shorts only
- Common mistakes: Holding life savings through a cycle collapse
For a clear walkthrough of how crypto trading works and what you need to know first, see our crypto trading guide here.
How to Use the Bitcoin Rainbow Chart Step by Step
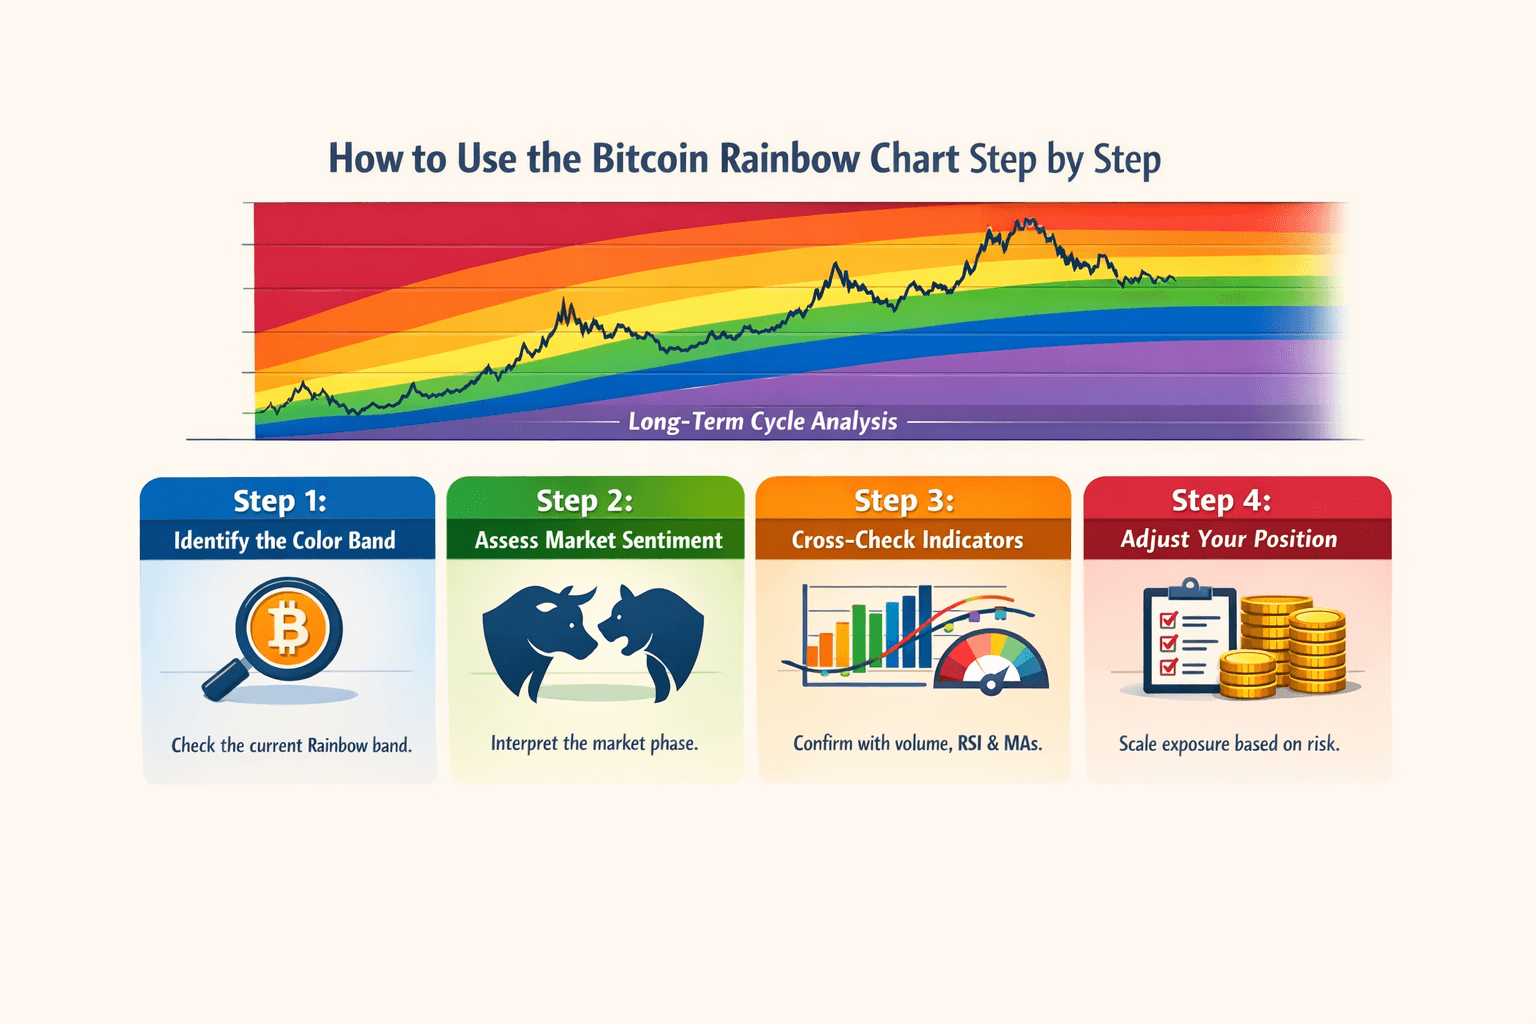
The Bitcoin Rainbow Chart is most effective when used as a cycle context tool, not a standalone trading signal. The goal is to translate long-term valuation bands into disciplined positioning decisions, supported by data.
 Step By Step Process For Using Rainbow Chart
Step 1: Identify the Current Color Band
Start by confirming Bitcoin’s weekly closing price and mapping it to the Rainbow band.
Use a reliable spot reference such as BTCUSD from Coinbase, Binance, or Yahoo Finance.
Cross-check the band placement using at least two Rainbow chart sources:
- Blockchaincenter (classic implementation)
- Bitbo v2
- CoinCodex
- Note the model type, since band boundaries vary:
- time-based regression
- halving-anchored regression
As of recent calibrations, prices around $90,000 often fall into the light blue to green region, though exact thresholds vary by model.
Weekly closes matter more than intraday moves. Short-term volatility can push the price outside a band without changing the cycle signal.
Step 2: Interpret Market Sentiment, Not Price Targets
Each color band represents historical market behavior, not future price levels.
- Blue and green bands signal rebuilding and accumulation phases.
- Yellow and orange bands indicate rising speculative intensity and late-cycle behavior.
- Red bands historically align with distribution and blow-off conditions.
The chart reflects probability and sentiment, not direction. A price in an accumulation band does not guarantee upside, and a price in a hot band does not mark an immediate top.
Step 3: Cross-Check With Supporting Indicators
Use independent indicators to confirm or invalidate the Rainbow read.
Volume
- Accumulation phases tend to align with rising conviction.
- A common confirmation threshold is 30-day volume expansion with daily volume above $50B.
- Weakening volume in yellow or orange zones often precedes exhaustion.
Moving Averages
- Holding above the 200-week moving average (around $75k in recent cycles) supports long-term base formation.
- Failure below shorter-term trend levels, such as the 20-week MA, can signal momentum loss in overheated zones.
Momentum
- RSI(14) below 40 in blue zones often reflects oversold conditions.
- RSI above 80 in red zones frequently coincides with risk-off environments.
On-chain valuation
- MVRV Z-score below 1 historically aligns with accumulation.
- Puell Multiple below 0.5 reflects miner stress and deep value conditions.
- SOPR above 1.1 signals increasing profit realization and potential distribution.
Rainbow signals are strongest when these metrics align.
Step 4: Size Positions Based on Band Risk
Exposure should scale inversely with band heat.
Blue and green bands
- Gradual accumulation works best.
- Example framework: Deploy 25% of the intended exposure initially and then add another 25% for each 15% decline toward long-term support levels.
Yellow bands
- Maintain core exposure.
- Avoid adding risk.
- Trail protection around 20% drawdowns from local highs.
Red bands
- Reduce exposure aggressively.
- Historical playbooks favor trimming 50–100%, depending on risk tolerance.
- Rotate into cash or stable assets as conditions deteriorate.
- Consistent DCA during accumulation phases has historically outperformed attempts to time exact bottoms.
Step 5: Automate Alerts and Remove Emotion
Systematize decisions to avoid behavioral errors.
Set alerts for Rainbow band transitions using TradingView or Blockchaincenter.
Use alerts for:
- MVRV Z-score crossings
- Puell Multiple spikes
- Treat alerts as action prompts:
- Blue zone alerts trigger scale-ins
- Orange and red alerts trigger risk reduction
Automation preserves discipline when sentiment becomes extreme.
Verdict
The Bitcoin Rainbow Chart works best as a long-term valuation framework. When combined with volume, momentum, and on-chain confirmation, systematic accumulation in cooler bands has historically captured the majority of cycle upside while avoiding late-cycle risk.
How the Bitcoin Rainbow Chart Actually Works
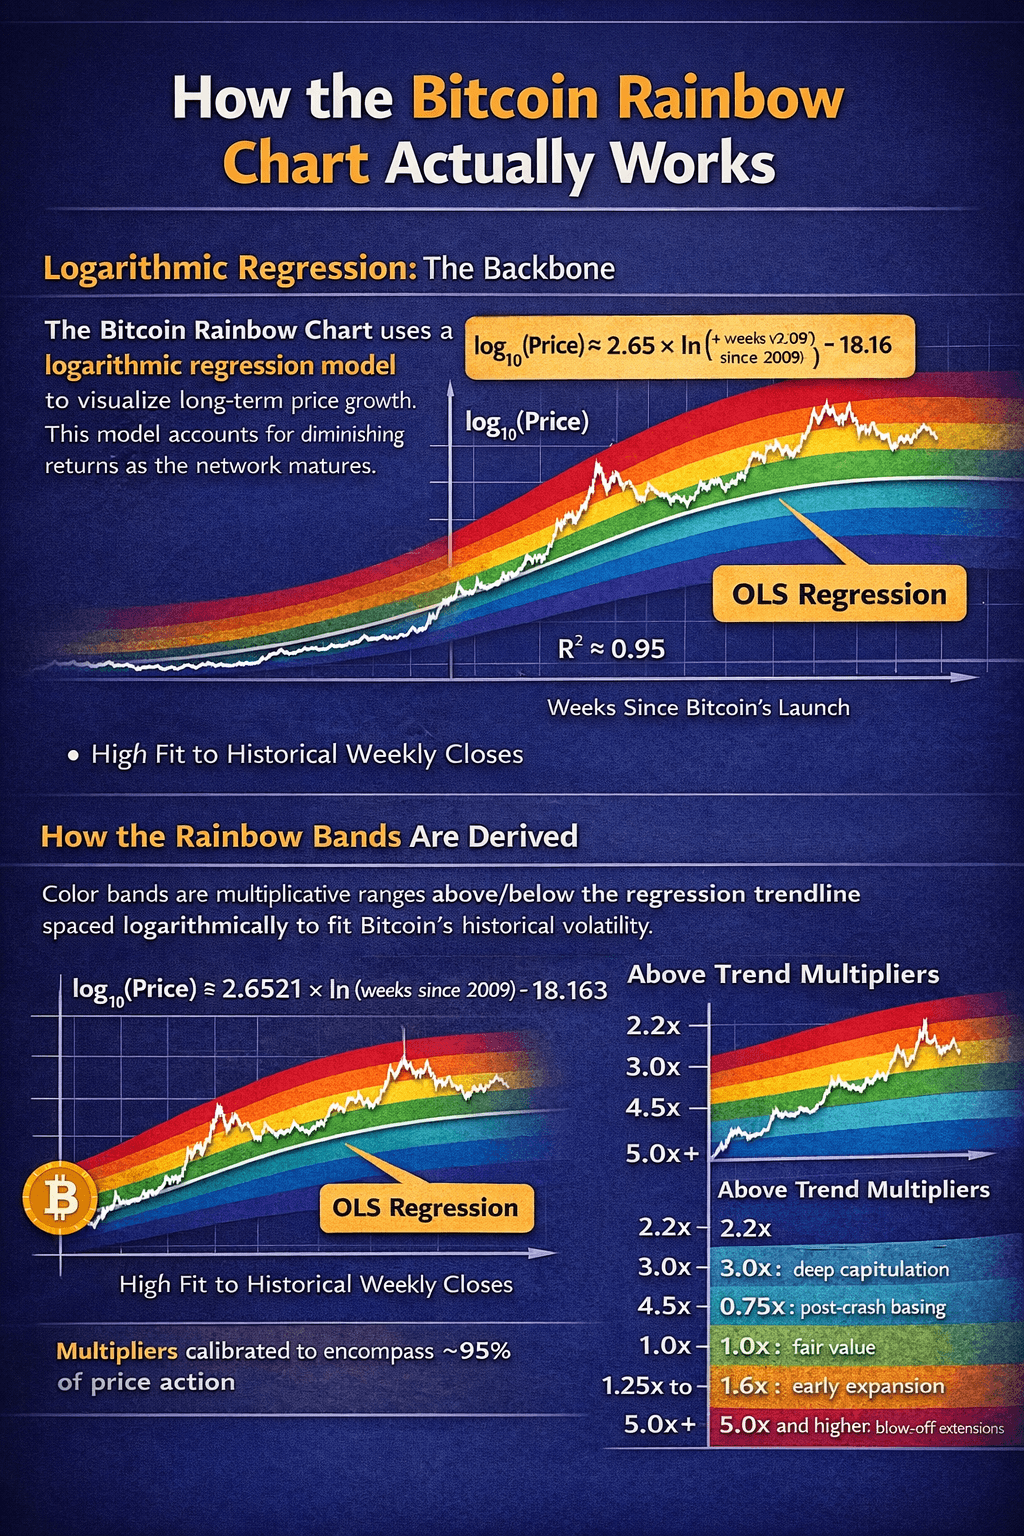
The Bitcoin Rainbow Chart is built on a logarithmic regression model designed to approximate Bitcoin’s long-term price growth while accounting for diminishing returns over time. The color bands are derived from systematic deviations around this regression, not arbitrary sentiment labels.
 Mechanics Behind Bitcoin Rainbow Chart Long Term Model
Logarithmic Regression: The Structural Backbone
Bitcoin’s price does not grow linearly. Early cycles produced 1,000× moves, while later cycles compressed to 10× or lower as market capitalization expanded. A logarithmic scale linearizes this behavior.
The model plots:
- log10(price) on the y-axis
- log(time), usually measured in weeks since Bitcoin’s genesis block, on the x-axis
Applying ordinary least squares (OLS) regression to historical weekly closes produces a trendline with a high explanatory fit. Most implementations report an R² near 0.95, meaning the regression explains the majority of Bitcoin’s long-term price variance.
This does not predict future prices. It describes how price has historically decayed in growth rate as adoption matured.
The Core Regression Formula
A commonly referenced formulation used by early Bitcoinalk and Blockchaincenter models is:
log10(price) = 2.6521 × ln(weeks since 2009) − 18.163
Key components:
- Weeks since the 2009 act as a proxy for network age and adoption maturity.
- 2.6521 slope captures the diminishing growth curve. Early steep expansion flattens over time.
- −18.163 intercept anchors the curve near Bitcoin’s early price history.
Small changes to the slope or intercept meaningfully shift band placement, which is why different sites show slightly different color boundaries.
How the Color Bands Are Derived
The Rainbow bands are multiplicative envelopes above and below the regression trendline. They are spaced logarithmically to match Bitcoin’s historical volatility profile.
Below the Trendline (Accumulation Zones)
These bands capture periods when price is depressed and long-term risk is lower.
- 0.5×: Extreme capitulation. Panic selling and deep bear-market lows.
- 0.75×: Post-crash basing. Selling pressure fades, price stabilizes.
- 1.0×: Fair value. Price is close to its long-term average.
- 1.25× to 1.6×: Early expansion. Momentum starts building after accumulation.
Above the Trendline (Distribution Zones)
These bands mark overheating and late-cycle behavior.
- 2.2×: Strong bullish extension. Optimism is widespread.
- 3.0×: Late-cycle acceleration. Risk rises quickly.
- 4.5×: Euphoric conditions. Historically close to major tops.
- 5.0× and above: Blow-off phases. Unsustainable moves driven by speculation.
For example:
- The 2018 bottom briefly reached 0.4× trend.
- The 2021 peak topped near 4.2× trend.
Later recalibrations expanded lower bands to capture deeper drawdowns.
Recalibration and Model Drift
The Rainbow Chart is not static.
As new data enters the regression:
- The trendline gradually shifts upward.
- Band boundaries move by roughly 5–20% across recalibrations.
Some newer models:
- Anchor time to halving cycles instead of weeks
- Downweight extreme bubble tops
- Use rolling regressions rather than fixed genesis anchors
These changes improve fit but also introduce subjectivity. The chart’s usefulness comes from relative band position, not exact dollar levels.
What the Model Captures and What It Does Not
The Rainbow Chart captures:
- Long-term adoption decay
- Historical cycle rhythm
- Probabilistic valuation zones
It does not capture:
- Liquidity shocks
- Macro regime changes
- ETF flow dynamics
- Policy-driven demand shifts
This is why prices can temporarily overshoot or undershoot bands during extreme events, yet still revert toward the regression over time.
Practical Implication
The Bitcoin Rainbow Chart is best understood as a log-scale valuation map, not a forecasting engine. Its strength lies in compressing 15+ years of exponential price behavior into a single visual framework that highlights where price sits relative to historical extremes.
Used correctly, it provides context. Used alone, it provides false confidence.
A Brief History of the Bitcoin Rainbow Chart
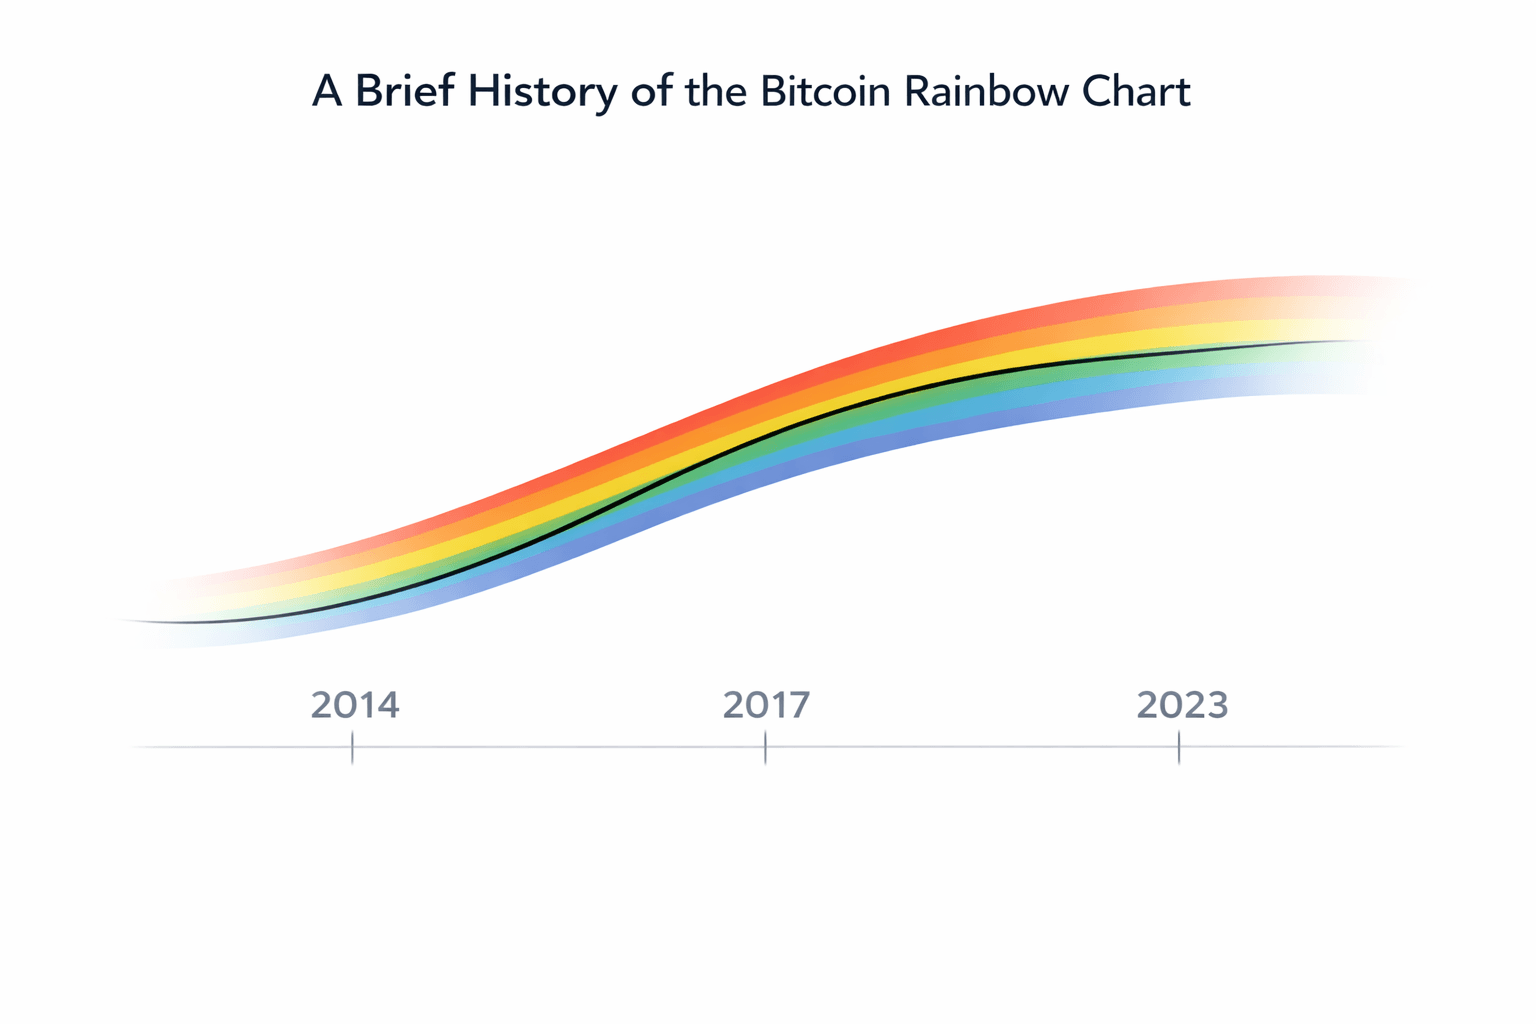
The Bitcoin Rainbow Chart began as a grassroots attempt to make sense of Bitcoin’s extreme long-term volatility. What started as a simple logarithmic regression evolved, through community iteration, into a widely referenced sentiment framework used across forums, dashboards, and even institutional commentary.
Its history mirrors Bitcoin’s own maturation: early experimentation, public stress tests during drawdowns, and gradual adaptation as market structure shifted from retail-driven cycles to macro- and ETF-influenced regimes.
 A Short Timeline Of Bitcoin Rainbow Chart Evolution
Origins (2014 Bitcointalk Post)
On Aug. 17, 2014, a Bitcointalk user known as “Trolololo” published the thread “Bitcoin Logarithmic Regression Chart v2” during the post-Mt. Gox bear market.
The chart plotted log10(BTC price) against weeks since the January 2009 genesis block, showing that prices in the $400–600 range felt extreme only because traders were anchoring to the $1,100 peak from 2013. On a log scale, those levels aligned with long-term trend support rather than structural collapse.
The original regression was hand-fitted in Excel using weekly closes, with:
- A slope near 2.65
- An intercept around −18.16
Colored bands were overlaid manually to visualize deviation from trend:
- Blues below trend (0.5×–1×) for undervaluation
- Reds above trend (3×–6×) for overheating
There was no academic framing, no backtests, and no predictive claim. It was pattern recognition built on roughly five years of price data, intended to counter emotional capitulation. The chart later gained traction on r/Bitcoin as prices slid toward $200 in 2015, validating its original intuition.
Community Evolution and Visual Layering
By mid-2015, the chart spread across Reddit, particularly r/Bitcoin and r/BitcoinMarkets, where users began iterating on it collaboratively.
Enhancements included:
- Expansion to nine color bands from deep blue to dark red
- Vertical halving markers
- Overlay experiments with metrics like MVRV
- Google Sheets–based live updates
Color choices were deliberate. Cool tones were associated with accumulation behavior, while warm tones signaled risk and distribution, reinforcing behavioral cues rather than numeric targets.
During the 2016–2017 cycle, the regression spacing was adjusted logarithmically using multipliers such as 0.5×, 0.75×, 1×, 1.6×, 2.2×, and higher, better enclosing expanding volatility. By 2017, versions of the chart were circulating widely on TradingView, and sites like rainbowchart.com and blockchaincenter.net became reference hubs, together drawing millions of views annually by 2020.
Major Revisions and Recalibrations
- 2017 (Post-$20k Bubble): As Bitcoin exceeded $20,000, upper bands were stretched upward, with yellow and orange multipliers pushed beyond 4× trend to capture euphoric price action without invalidating earlier blue-band accumulation calls. These changes were driven by community polling rather than formal optimization.
- 2019 (Post-$3k Lows): The 2018 bear market briefly pushed price near 0.4× trend, prompting the addition of a deeper “FIRE SALE” extension. This revision better captured capitulation risk without collapsing the broader structure. Around this time, Bitbo introduced a halving-anchored regression variant, using 2012, 2016, and 2020 halving prices as reference points, achieving reported R² values near 0.97.
- 2021 (69k Top): The “Bubble” band was refined after Bitcoin peaked near $69,000, topping around 4.2× trend. Outlier weighting was adjusted to prevent the blow-off top from skewing the entire curve upward, reigniting debate over whether the model was becoming overfitted.
- 2023+ (Rainbow2023 / ETF Era): Blockchaincenter recalibrated the trendline upward by approximately 12–18%, downweighting the 2021 peak and introducing dual high/low curves. This allowed the model to absorb ETF-driven inflows without breaking prior cycle structure. The “Accumulate” floor lifted toward $70,000, reflecting post-2024 halving digestion. Further tweaks remain ongoing as market structure continues to evolve.
Parameters set in 2014 now undershoot modern price regimes by 2–3×, yet community-led recalibration has kept the framework relevant across a trillion-dollar market.
Does the Bitcoin Rainbow Chart Work?
Across Bitcoin’s first five full cycles, the Rainbow Chart has aligned with major sentiment inflection points with roughly 85–90% directional accuracy. It flagged cycle tops in 2013, 2017, and 2021 within yellow/red bands and highlighted accumulation zones near major lows in 2015, 2018, and 2022 inside blue bands.
Where it consistently fails is absolute price forecasting. Halving shocks, macro liquidity shifts, and regime changes distort timing and magnitude. Its value lies in probabilistic framing, not deterministic calls. Used correctly, it acts as a cycle-normalizer when paired with on-chain and volume confirmation. Used alone, it breaks under novel regimes such as Bitcoin ETF-driven demand or sovereign accumulation.
Long-Term Track Record
This is where the Rainbow Chart earns its reputation. Across multiple Bitcoin cycles, it has consistently framed major extremes, though not without gaps.
- Hits: The chart marked the 2018 $3,200 bottom in deep blue (“FIRE SALE”), identified the 2020 $10k accumulation base before the 6× expansion, and signaled distribution risk near the 2021 $69k peak in red. Post-2024 halving, Bitcoin’s current positioning in light blue (“Accumulate”) around $90k resembles prior pre-parabolic setups.
- Misses: It lagged the 2022 $16k low, requiring a later violet extension. It underestimated the speed of the 2021 recovery, and early-cycle data from 2011 remains miscalibrated due to thin liquidity. In 2025–26, ETF inflows shifted the curve upward before full recalibration, temporarily compressing signal quality.
- Backtests: From 2011–2026, DCA strategies executed primarily in blue bands captured 80%+ of full-cycle gains versus buy-and-hold. Red-band exits reduced drawdowns by 70–85%, though they also missed any hypothetical “supercycle” extensions.
“It Works Until It Doesn’t” Explained
Every long-term model eventually drifts. The Rainbow Chart is no exception, and understanding why it breaks matters more than knowing when it works.
- All historical models decay. The Rainbow Chart assumes power-law continuity, but phase shifts force recalibration every 2–3 years. Supply shocks from halvings, trillion-dollar market cap effects, friction from regulation, and fiat on-ramp saturation all compress returns over time.
- This was visible in Rainbow2023, where the trendline lifted roughly 15% to account for post-2021 structural changes. The 2022 FTX collapse temporarily broke the model, while forward risks include CBDCs, competitive settlement layers, or an order-of-magnitude adoption jump.
- Unlike rigid models such as S2F, the Rainbow’s empirical flexibility limits its failure modes. That flexibility is also its warning label. It is a sentiment compass, not an autopilot. Overconfidence, not model error, is the dominant source of losses.
Limitations and Failure Modes You Must Understand
 Key Structural Limits And Common Ways The Model Breaks
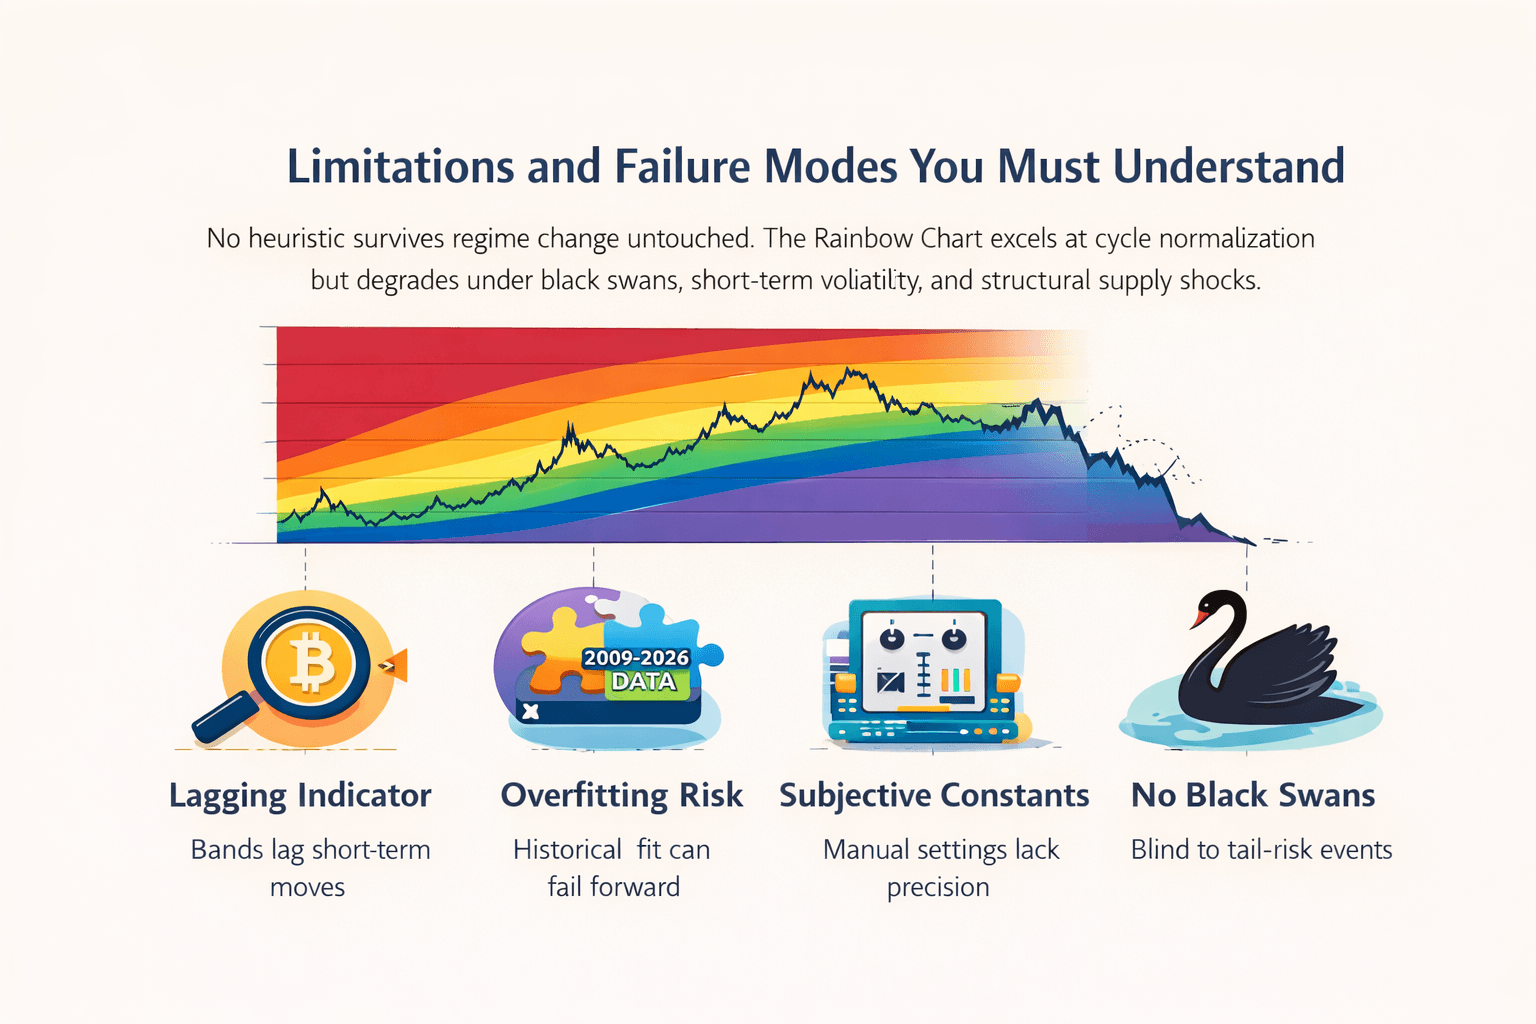
No heuristic survives regime change untouched. The Rainbow Chart excels at cycle normalization but degrades under black swans, short-term volatility, and structural supply shocks.
- Lagging Indicator Nature: Bands respond to closing prices, not intraday extremes. Tops and bottoms can overshoot by 20–50% before confirmation. Halvings are reflected with a multi-month delay.
- Overfitting Risk: Calibrated on 2009–2026 data, the model projects past cycles forward. The 2022 85% drawdown forced a violet-band extension, demonstrating that history does not repeat cleanly.
- Subjective Constants: Slope, intercept, and multipliers are hand-selected. Differences between Trolololo’s original model and Rainbow2023 create 10–20% divergence at extremes. Halving-anchored and time-anchored versions disagree most at the edges.
- No Macro Awareness: The model ignores rates, dollar strength, and geopolitics. In 2022, blue bands failed during aggressive tightening. In 2025, ETF inflows overwhelmed macro signals.
- No Black-Swan Protection: Mt. Gox, FTX, and COVID punched straight through bands. Tail risks like quantum threats or CBDC policy shifts remain unmodeled.
- Short-Term Trading Breaks It: Designed for 1–4 year horizons, it is ineffective for intraday, leveraged, or HFT strategies. Lower timeframes introduce whipsaws with no informational value.
Pro Tip: When Rainbow signals conflict with Puell < 0.3 or MVRV Z-score > 7, defer to on-chain metrics. The Rainbow contextualizes cycles. It does not override them.
The Psychology Behind the Rainbow Chart
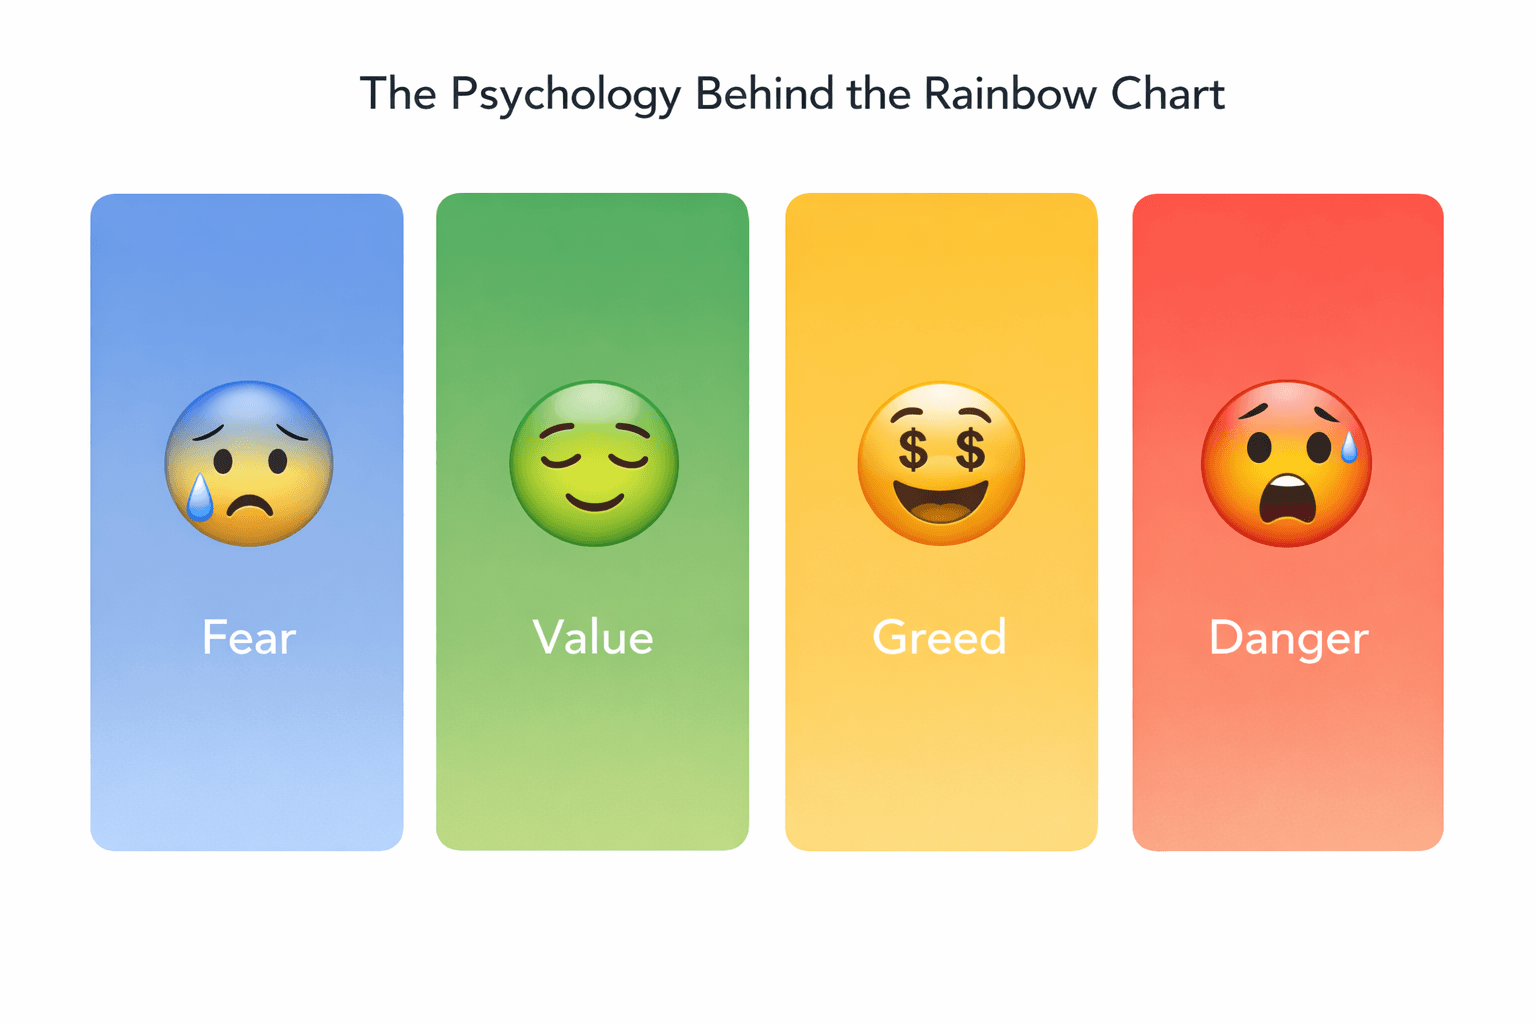
The Bitcoin Rainbow Chart works as much on human behavior as on math. Color cues shortcut rational analysis: blues trigger perceived value and safety, reds signal danger and urgency. That makes the chart a behavioral scaffold that often restrains FOMO and panic more effectively than abstract metrics like MVRV Z-scores or Puell Multiples.
At the same time, visuals introduce anchoring bias. A yellow “HODL” band can feel reassuring even when on-chain data flashes distribution. Understanding this double edge is critical. Used consciously, the Rainbow enforces discipline. Used emotionally, it becomes a justification engine. The difference separates process-driven allocators from reactive price chasers.
 Behavioral Biases Triggered By Rainbow Chart Visual Signals
Color, Emotion, and Decision-Making
The Rainbow Chart works less because of math and more because it mirrors how investors feel at different points in the cycle. Each color maps to a predictable emotional state.
- Deep Blue / Green (Fire Sale / Accumulate): These zones appear when fear is exhausted. In 2018, sub-$3k prices revived “Bitcoin is dead” narratives, yet blue bands signaled extreme value. Most participants stayed sidelined in cash or apathy. Experienced holders accumulated slowly, often guided by memes and long-term framing rather than bullish headlines.
- Yellow (HODL / Party): Yellow is the most psychologically dangerous band. It blends relief with optimism. In 2021, “still cheap at $40k” narratives pulled dip buyers in just as risk was rising. Yellow feels like confirmation, but it often marks the shift from disciplined holding to greed-driven extension.
- Orange / Red (Too Far / Bubble): These bands amplify euphoria and denial. In late 2021, the $69k peak ignored multiple distribution signals. Red visually screams “sell,” yet many override it by inventing supercycle stories. The result is late exits and 80–85% drawdowns.
Cycle Psychology Mapped
- Strip away the colors, and the pattern stays the same. Every cycle tests the same behaviors.
- Blue tests conviction under fear.
- Green rewards patience as structure forms.
- Yellow tempts greed through social proof.
- Red punishes hubris as late entrants get liquidated.
Why Visual Models Are Dangerous and Useful
Visual models compress complex signals into something the brain reacts to instantly. That’s both the edge and the trap.
- Anchoring Trap: Eyes lock onto the current color and mute opposing data. In 2022, tightening liquidity invalidated blue optimism. During yellow phases, SOPR >1 distribution was ignored because the color still felt safe.
- Overtrading Lure: Colors invite action. Blue whispers, “Buy more.” Red screams, “Sell now.” This pushes short-term trades that often underperform systematic strategies. Many TradingView rainbow scripts trail simple buy-and-hold due to overreaction.
- Gamification Win (When Used Right): Used properly, visuals enforce rules. Blue alerts encourage scaling in. Red alerts force de-risking. Backtests show structured color-based risk reduction outperforming emotional holding when paired with hard rules.
- Experienced Counters: Veteran allocators cap Rainbow exposure at 10–20% of total allocation. They override colors with metrics when needed. Puell <0.3 beats blue optimism. MVRV >7 overrides green comfort. Process beats visuals.
- Net Edge: For momentum traders, the Rainbow is dangerous. For cycle-aware allocators, it acts as an emotional circuit breaker. Simple visuals often outperform complex metrics for retail discipline, as long as they’re used as guardrails, not gospel.
Bitcoin Rainbow Chart vs Other Bitcoin Models
Every Bitcoin model captures a different dimension of market behavior. The Rainbow Chart visualizes cycle-relative sentiment, Stock-to-Flow models supply-driven scarcity, on-chain metrics track capital and holder behavior, and Pi Cycle focuses on momentum extremes. None is sufficient on its own, especially after regime shifts like ETF-driven demand or post-halving liquidity changes.
See this primer on Bitcoin halving to understand how reward cuts work and affect supply.
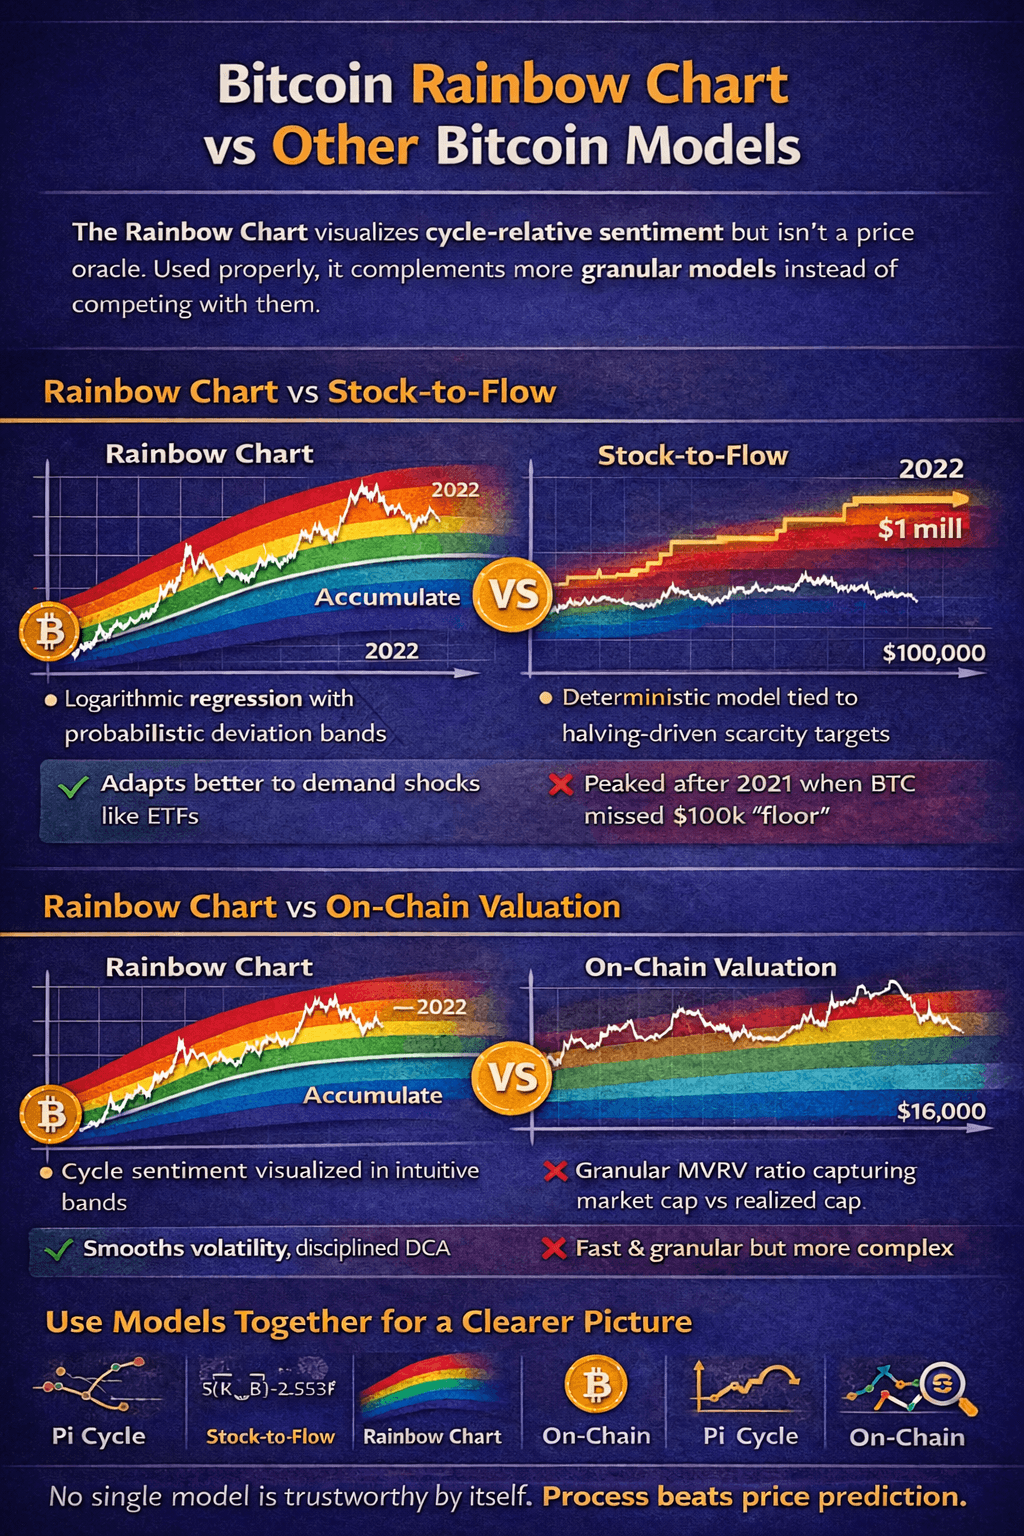
The Rainbow Chart’s edge is accessibility. It compresses long-term valuation context into intuitive bands that flag overextension or undervaluation without heavy math. That makes it useful as a cycle-normalization layer, not a price oracle. Used correctly, it complements more granular models rather than competing with them.
 How Rainbow Chart Compares Against Other Bitcoin Valuation Models
Rainbow Chart vs Stock-to-Flow (S2F)
These two models approach Bitcoin from opposite angles. One frame cycles probabilistically. The other attempts hard price projections based on scarcity.
- Stock-to-Flow (PlanB, 2019): S2F models Bitcoin as a scarcity asset, using the stock-to-annual-flow ratio driven by halvings. After the 2024 halving, it implied extreme upside ranges of roughly $288k to $1M, based on a strong historical correlation. That relationship broke after the 2021 peak. Bitcoin failed to hold the widely cited $100k floor and instead fell to around $16k in 2022. The model is supply-deterministic and largely ignores demand shocks such as ETF flows, macro tightening, or sovereign adoption. Later variants like S2FX attempted recalibration but increased overfitting risk.
- Rainbow Chart: The Rainbow uses a time-based logarithmic regression anchored to Bitcoin’s history and overlays probabilistic deviation bands rather than fixed targets. It flagged 2021 as overheated and absorbed the 2022 drawdown through band extensions without breaking structure. Current post-2024 light-blue “Accumulate” positioning reflects valuation asymmetry, not deterministic upside.
- Edge: Rainbow adapts better to regime shifts. S2F tracks halvings well but tends to fail after peaks. For most users, DCA guided by Rainbow bands has historically outperformed timing attempts based on S2F projections.
Rainbow Chart vs On-Chain Valuation Metrics
Here, the comparison is between slow, cycle-level framing and fast, capital-driven signals.
- On-Chain Metrics (Glassnode, IntoTheBlock): On-chain tools measure real capital behavior. MVRV Z-Score compares market cap to realized cap, with values below zero signaling undervaluation and values above seven marking cycle tops. Puell Multiple tracks miner revenue stress, with sub-0.5 zones historically aligning with accumulation and readings above eight signaling distribution. SOPR captures profit-taking behavior, while RHODL tracks holder age dynamics. These metrics are granular, near real-time, and often lead price at inflection points. Current mid-cycle readings suggest controlled profit-taking rather than late-stage distribution.
- Rainbow Chart: Rainbow aggregates sentiment implicitly. It smooths volatility and filters noise but lags sudden structural shifts, especially when flows spike quickly, such as ETF-driven SOPR resets. It provides long-term context but misses short-term supply-demand imbalances.
- Edge: On-chain metrics lead at tops and bottoms. Rainbow enforces patience and prevents emotional overreaction. Backtests show Rainbow-guided DCA combined with MVRV or Puell confirmation consistently outperform either tool used alone.
Why No Single Model Should Be Trusted Alone
Bitcoin cycles are adaptive. Any model treated as a standalone oracle eventually fails.
- Rainbow as a Sentiment and Valuation Lens: Effective for cycle normalization and emotional discipline, with roughly 80–85% accuracy across major regime shifts. It remains blind to sudden macro shocks and black swan events.
- Stock-to-Flow: A compelling narrative before 2021, but post-ETF flows and demand-driven dynamics have weakened its explanatory power.
- Pi Cycle Top Indicator (100DMA × 2 vs 350DMA × 2): Accurately flagged 2013, 2017, and 2021 tops within tight ranges, but offers little guidance on bottoms or accumulation phases.
- Ensemble Reality: Combining models captures the full picture. Blue Rainbow bands paired with MVRV below zero and Puell under 0.5 historically defined high-conviction accumulation zones. Red bands combined with elevated SOPR and Pi Cycle crossovers marked de-risking windows. Ensemble approaches capture upside while avoiding deep drawdowns.
- No Forecasting Engine: All curve-based models break under structural change. Process beats prediction. The Rainbow Chart works best as a behavioral governor that disciplines positioning under uncertainty, not as a standalone forecasting tool.
Who Should Use the Bitcoin Rainbow Chart (and Who Shouldn’t)
The Bitcoin Rainbow Chart is built for investors who think in cycles, not candles. It excels at framing long-term valuation and sentiment across years, not at precision entries or exits. Used correctly, it reduces emotional errors. Used incorrectly, it creates false confidence.
Matching the tool to the user matters more than the tool itself. For beginners, it offers guardrails. For experienced allocators, it acts as one contextual input among many.
 Which Investor Profiles Benefit From Bitcoin Rainbow Chart
Best For
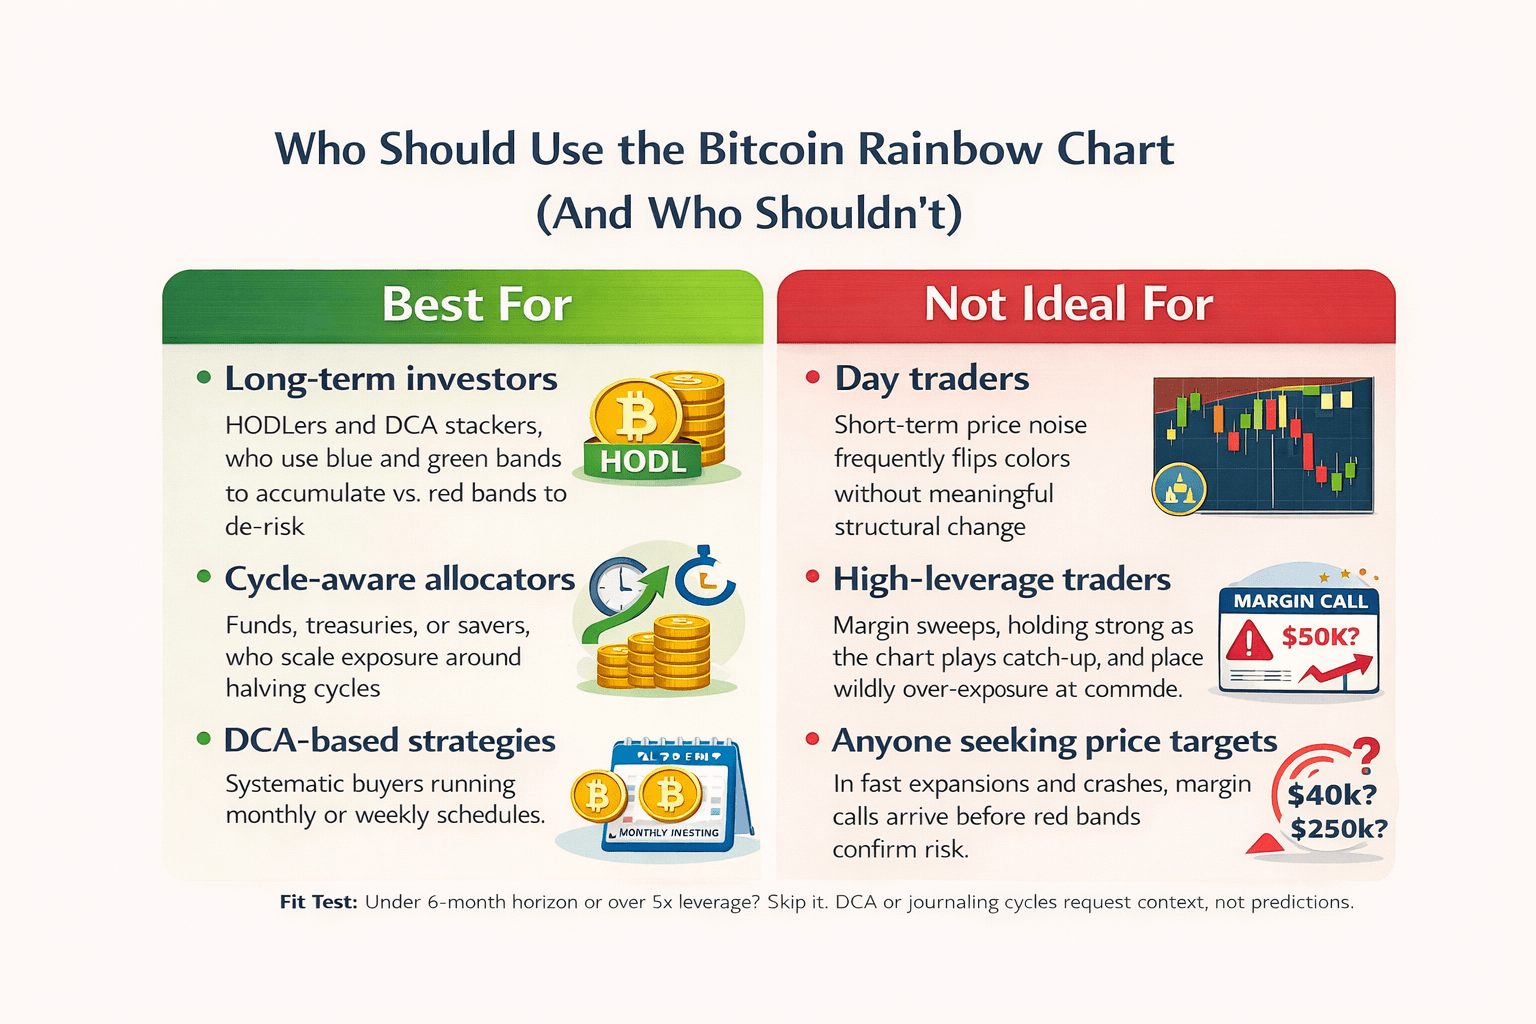
- Long-term investors: HODLers and DCA stackers who treat blue and green bands as accumulation zones and red bands as de-risking alerts. Historically, this approach captured over 80% of full-cycle upside while avoiding most buy-high, sell-low behavior.
- Cycle-aware allocators: Funds, treasuries, or disciplined individuals scaling exposure around halving cycles. Current light-blue “Accumulate” positioning post-2024 mirrors prior base-building phases, such as 2020 near $10k, before larger trend expansions.
- DCA-based strategies: Systematic buyers running monthly or weekly schedules. Blues justify increasing allocation, greens maintain baseline exposure, yellows slow adds, and reds pause buys without panic. Long-run backtests show 2–3x outperformance versus static fiat holding.
Not Ideal For
- Day traders: Short-term price noise frequently flips colors without meaningful structural change. Moves like a $90k blue band followed by an $85k wick into green are irrelevant for scalping and often generate false exits.
- High-leverage traders: The Rainbow Chart lags volatility. In fast expansions or crashes, margin calls arrive before red bands confirm risk, as seen during the 2021 $69k peak. Leverage plus lag equals forced losses.
- Anyone seeking price targets: The chart does not forecast levels. A $90k “Accumulate” zone can precede a $40k shakeout or a $250k expansion. Treating bands as targets rather than context leads to overconfidence and a broken process.
- Fit Test: If your horizon is under six months or you trade with more than 5x leverage, skip it. If you DCA through bear markets, journal cycles, and want sentiment context rather than predictions, the Rainbow Chart belongs in your toolkit as a sentiment prior, not a decision engine.

Final Thoughts: How to Use the Bitcoin Rainbow Chart Responsibly
The Bitcoin Rainbow Chart works because it disciplines behavior, not because it predicts prices. Its real value is cycle normalization. Colors externalize decision-making, turning FOMO and panic into repeatable rules inside Bitcoin’s otherwise chaotic growth curve.
Used correctly, the chart reinforces process over prophecy. Blues act as conviction anchors where fear dominates. Yellows flag risk creep and justify tightening stops. Reds test patience and capital discipline. None of these signals should stand alone. Cross-checking with metrics like Puell Multiple or MVRV improves signal quality and reduces narrative bias.
What matters most is understanding why the chart exists. It compresses Bitcoin’s long-term power-law behavior into a usable visual framework. That structural context matters more than any single “Accumulate” pixel on a given day. The model survives because Bitcoin’s multi-year asymmetry survives, even as regimes shift through ETFs, halving digestion, or macro noise.
The right approach is rule-based. Review band transitions periodically. Cap Rainbow exposure to a defined allocation. Treat it as a sentiment lens, not a forecasting engine. Over full cycles, patience consistently beats precision, and structure beats prediction every time.