To backtest a crypto strategy, define exact entry and exit rules, collect historical market data, apply fees and slippage, run the rules through past price action, review returns and drawdowns, then validate the strategy with out-of-sample and paper trading before using real capital.
This guide covers how to backtest a crypto strategy, choose the right data and tools, add realistic costs, read the results, avoid common mistakes, and validate the strategy before moving to paper trading or small live deployment.
Editor's Note (June 27, 2026): We fully updated this article in June 2026. The new version adds clearer step-by-step guidance, updated tool coverage, stronger sections on fees, slippage, funding, DEX execution and validation, plus a practical checklist for moving from backtesting to paper trading and small live deployment.
Quick Answer: How to Backtest a Crypto Strategy
To backtest a crypto strategy, turn the idea into exact trading rules, choose historical data that matches the asset and timeframe, add position sizing, fees, slippage, funding, and realistic execution assumptions, then review the results against a benchmark. A useful backtest does not predict the future. It helps you decide whether a strategy is worth testing further before real capital enters the arena.
Key Takeaways for Crypto Backtesting
-
Start with testable rules Replace vague ideas like "buy strength" with clear rules for entries, exits, position size, stop-losses, take-profits, and trade filters.
-
Use the right data Daily swing systems can use OHLCV candles, while scalping, perps, and DEX strategies need more detailed data and execution assumptions.
-
Add real trading costs Fees, spreads, slippage, funding rates, gas, price impact, and partial fills can turn a pretty paper strategy into a pumpkin.
-
Record every trade A trade log shows whether returns came from repeatable rules or a few lucky outliers wearing a lab coat.
-
Compare against a benchmark A crypto strategy should be judged against BTC, ETH, a DCA plan, cash, or another fair benchmark after costs.
-
Validate before going live Use out-of-sample testing, paper trading, and small live tests before trusting the strategy with meaningful capital.
The Crypto Backtesting Workflow
- Step 1: Define the strategy with exact entry, exit, sizing, and risk rules.
- Step 2: Choose historical data that matches the asset, exchange, timeframe, and strategy type.
- Step 3: Pick a testing method such as a spreadsheet, TradingView, Python, Freqtrade, or a no-code backtester.
- Step 4: Add realistic costs including fees, slippage, spread, funding, gas, and liquidity assumptions where needed.
- Step 5: Run the test and record every valid trade, not just the neat ones.
- Step 6: Review the results using net return, max drawdown, profit factor, trade count, losing streaks, and benchmark comparison.
- Step 7: Validate the strategy with out-of-sample testing, paper trading, and small live deployment.
Best Path for Different Crypto Backtesters
| User Type | Best Starting Method | Why |
|---|---|---|
| Complete beginner | Spreadsheet or TradingView Replay | Simple and visual |
| Chart-based trader | TradingView Strategy Tester | Easy Pine Script testing |
| No-code bot user | No-code bot backtester | Good for grid, DCA, and bot workflows |
| Python learner | Google Colab or Backtesting.py | Flexible and reproducible |
| Bot builder | Freqtrade or custom Python | Better for automation |
| Futures trader | Tool with funding and leverage support | Needed for realistic results |
What a Backtest Can and Cannot Tell You
| Can Tell You | Cannot Tell You |
|---|---|
| How rules performed historically | Whether the strategy will work in the future |
| Max drawdown in the test | How you will behave emotionally |
| Sensitivity to fees and slippage | Exact future fills |
| Whether rules are repeatable | Whether the market regime will continue |
Disclaimer
This guide is educational only and is not financial advice. Backtesting does not guarantee future performance. You should never trade with money you cannot afford to lose.
Disclosure
Some links in this guide may be affiliate links. If you choose to use a service through these links, we may earn a commission at no additional cost to you.

What Is Crypto Backtesting?
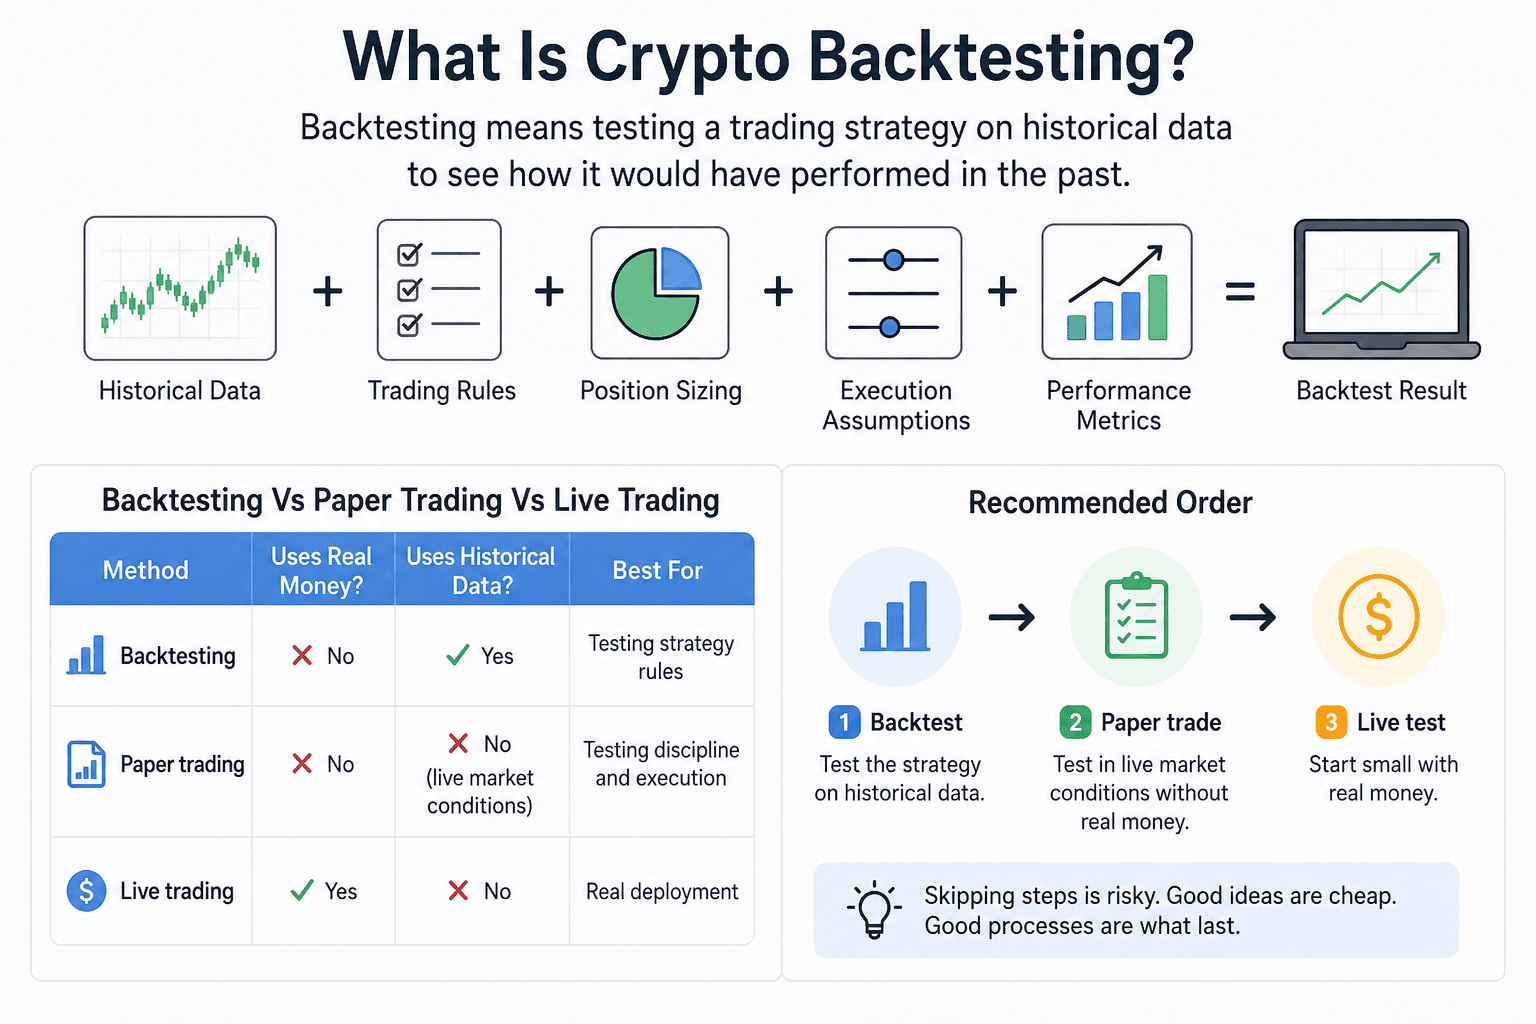
Crypto backtesting means replaying a trading strategy on historical crypto market data to estimate how the rules would have performed before risking real capital. Instead of saying “I would have bought that breakout,” a backtest asks a harder question: would the strategy have bought every similar breakout, exited by the same rules, paid costs, survived drawdowns and still made sense?
If price structure still feels fuzzy, start with crypto charts before testing indicators or breakout systems.
A backtest usually needs five ingredients: historical prices, trading rules, position sizing, execution assumptions and performance metrics. The result is only useful if those ingredients are handled honestly.
 Replay Trading Rules Against Historical Crypto Market Data
Backtesting Vs Paper Trading Vs Live Trading
Backtesting uses historical data. Paper trading uses live market conditions but no real money. Live trading uses real capital, real fills and real emotions.
| Method | Uses Real Money? | Uses Historical Data? | Best For |
|---|---|---|---|
| Backtesting | No | Yes | Testing strategy rules |
| Paper trading | No | No, uses live market conditions | Testing discipline and execution |
| Live trading | Yes | No | Real deployment |
The order should usually be backtest first, paper trade second, small live test third. Skipping straight from a good chart idea to live trading is how many strategies get tested in the most expensive way possible.
Why Crypto Backtesting Is Different From Stock Backtesting
Crypto backtesting has its own traps because crypto market structure is different. Bitcoin trades 24/7. Ethereum trades across centralized exchanges, Layer 2s and onchain venues. Fees vary across platforms. Liquidity can vanish quickly in smaller altcoins. Perpetual futures have funding rates. DEXs may involve gas, price impact, MEV and pool depth.
A daily BTC trend strategy may survive these differences, a five-minute altcoin scalping strategy may not. The shorter the timeframe and the smaller the edge, the more execution quality dominates the result.
Step 1: Turn Your Crypto Strategy Into Testable Rules
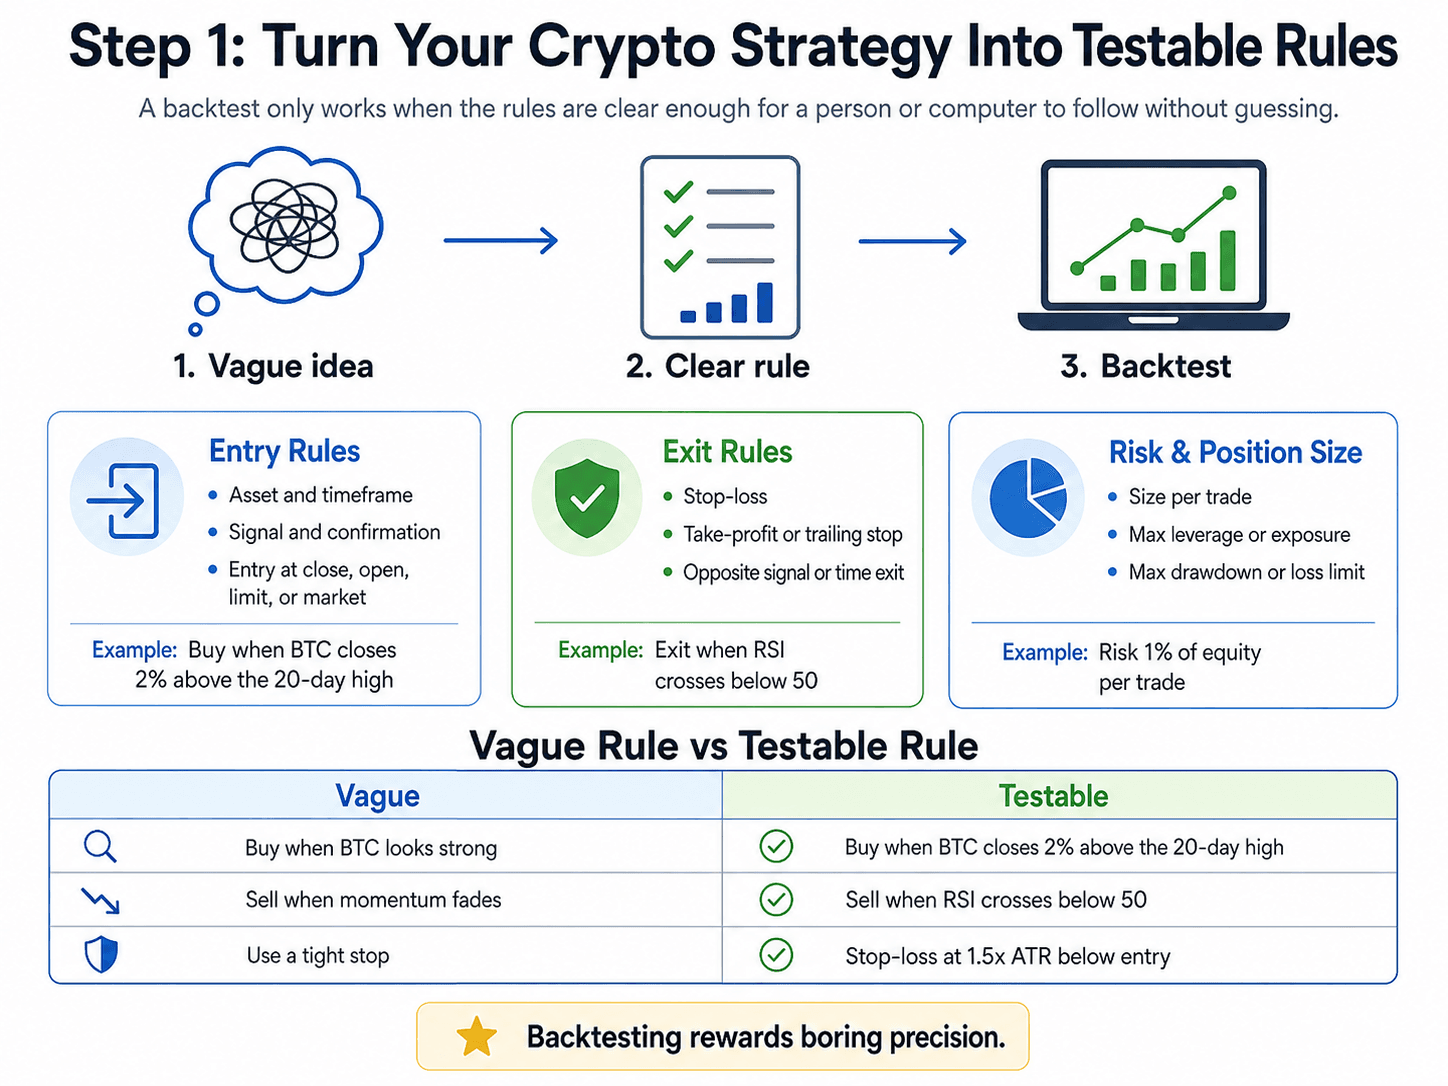
A strategy is ready for backtesting only when another person or a computer can execute it without guessing what you meant. “Buy strength” is not a rule. “Buy when BTC closes 2% above the 20-day high” is a rule.
This is where many first backtests fail. The trader already knows what happened on the chart, so the eye quietly edits the rules. Bad signals get ignored. Good signals get remembered. The backtest becomes a story, not a test.
 Turning Trading Ideas Into Rules A Backtest Can Execute
Define Entry Rules
Entry rules decide when the strategy opens a position. They should include the asset, timeframe, signal and confirmation logic.
Examples:
- Buy when the 50-day SMA crosses above the 200-day SMA.
- Buy when RSI crosses back above 30 after being oversold.
- Buy when price closes above a defined resistance level and volume is at least 30% above the 20-period average.
- Short when price breaks below the 20-day low and the broader market is below its 200-day moving average.
The rule should also say whether the trade enters at the close, the next open, a limit price, or a market order. That small detail can change the entire result.
Define Exit Rules
Exit rules decide when the strategy closes the position. Many traders obsess over entries because entries feel like prediction. Exits usually decide whether the strategy is actually tradable.
Common exit rules include:
- Opposite signal exit: Close when the trend signal reverses.
- Stop-loss: Exit if price moves a fixed percentage or volatility-adjusted distance against the trade.
- Take-profit: Close when price reaches a defined target.
- Trailing stop: Follow the trade as it moves in profit, then exit if it retraces.
- Time-based exit: Close after a set number of candles or days.
- Invalidated setup exit: Close when the reason for the trade no longer exists.
A moving average crossover strategy might exit on the opposite crossover. A breakout strategy might exit on a trailing ATR stop. A mean reversion strategy might exit when RSI returns to neutral. The exit should match the logic of the setup.
Define Risk And Position Sizing
Backtesting only entries and exits gives an incomplete picture. Position sizing decides how much each trade can hurt you.
A simple approach is fixed position size: every trade uses the same dollar amount. A more controlled method is fixed percentage risk: each trade risks, for example, 1% of account equity if the stop-loss is hit. Volatility-based sizing adjusts the position based on ATR or another volatility measure, so wider stops get smaller size.
The strategy should also define:
- Maximum open positions
- Maximum exposure to one asset
- Maximum leverage
- Maximum daily or weekly loss
- Maximum drawdown stop
- Whether profits are compounded or withdrawn from the test balance
Without sizing rules, a backtest may show a beautiful return curve that no real trader could sit through.
Vague Rule Vs Testable Rule
| Vague Rule | Testable Rule |
|---|---|
| Buy when BTC looks strong | Buy when BTC closes 2% above the 20-day high |
| Sell when momentum fades | Sell when RSI crosses below 50 |
| Avoid choppy markets | Trade only when ADX is above 25 |
| Use a tight stop | Stop loss at 1.5x ATR below entry |
| Buy the dip | Buy when price is 8% below the 20-day moving average and RSI is below 35 |
| Take profit when price runs | Sell 50% at 2R and trail the rest by 2x ATR |
The testable version may look less exciting, but that is the point. Backtesting rewards boring precision.
Step 2: Choose The Right Historical Crypto Data
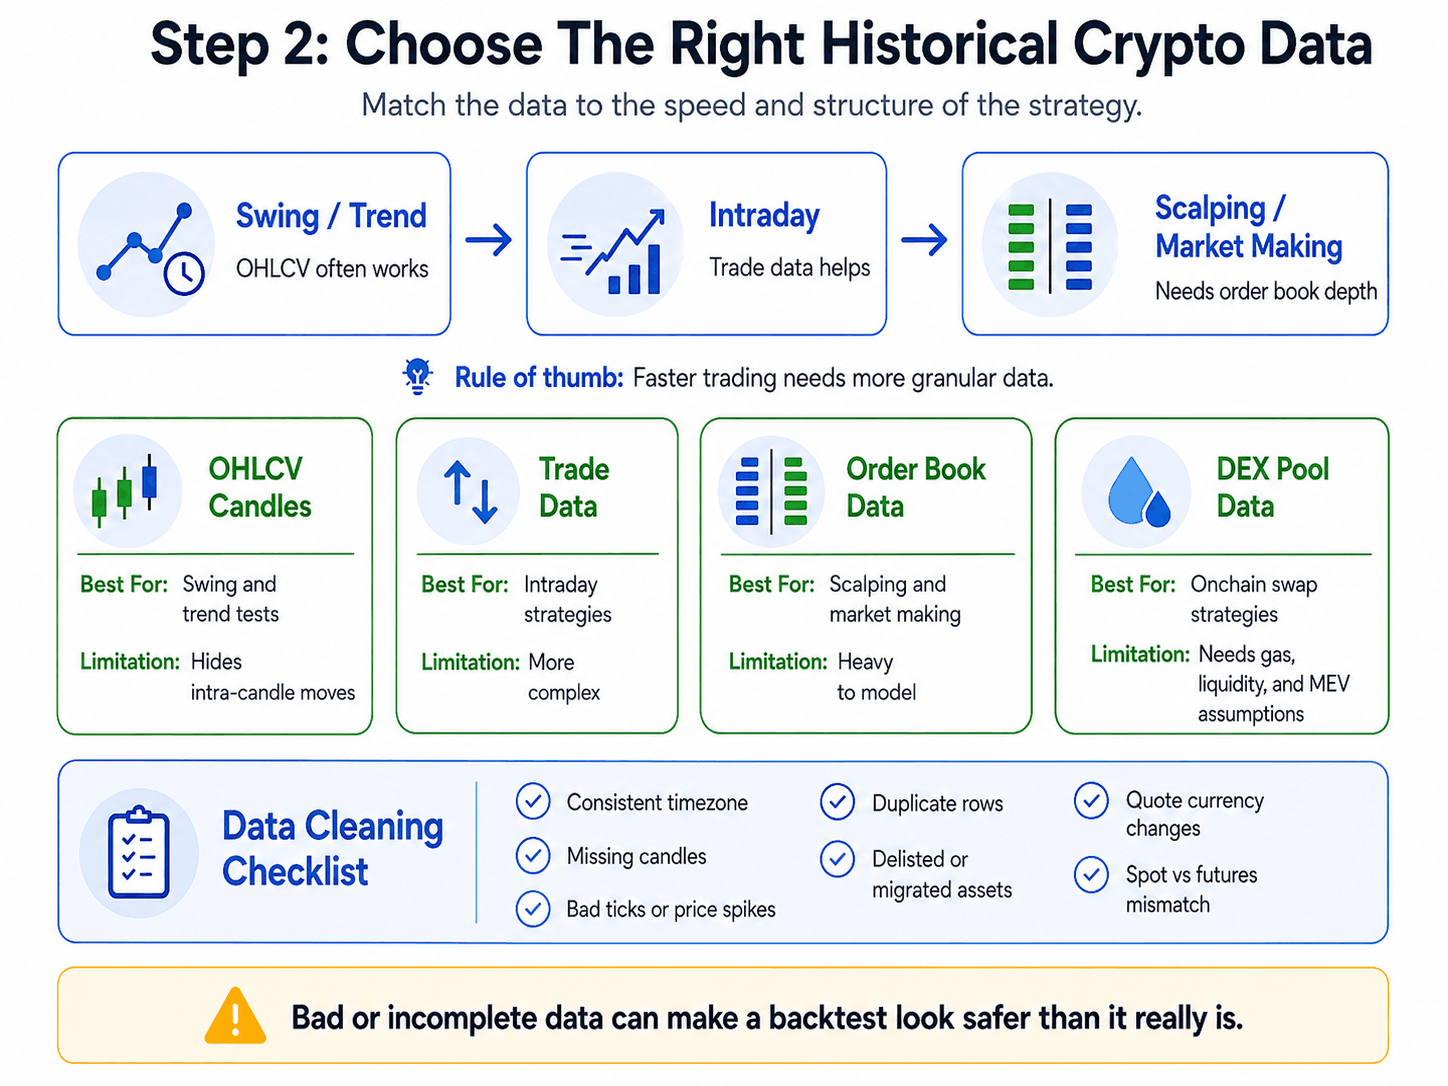
The data you use should match the strategy you are testing. A weekly trend-following strategy does not need tick-by-tick order book history and a scalping system cannot be tested honestly using only daily candles. For strategies quoted in stablecoins, the quote currency also matters. BTC/USDT, BTC/USDC and BTC/USD can have different liquidity, spreads and venue availability.
Historical data is not one clean thing. It comes in different formats, from simple OHLCV candles to full order book snapshots. Choosing the wrong format can make a strategy look safer than it is.
 Choosing Crypto Data That Matches Your Strategy Type
OHLCV vs Trade Data vs Order Book Data
OHLCV stands for open, high, low, close and volume. It is the standard candlestick format and works well for many swing, trend and beginner strategies. The limitation is that candles hide what happened inside the candle. If a one-hour candle hit both your stop and your take-profit, OHLCV alone may not prove which came first.
Trade data gives each executed trade. It is more useful for intraday systems because it shows actual transaction flow rather than summarized candles.
Order book data shows resting bids and asks. It is needed for scalping, market making and spread-sensitive strategies because those systems depend on whether liquidity was really available at the tested price.
DEX pool data is its own category. Onchain swaps need assumptions for pool depth, price impact, gas, MEV and token-level restrictions.
| Data Type | Best For | Main Limitation |
|---|---|---|
| OHLCV candles | Swing, trend and beginner tests | Hides intra-candle movement |
| Trade data | Intraday strategies | More complex to process |
| Order book data | Scalping and market making | Heavy and harder to model |
| DEX pool data | Onchain swap strategies | Needs liquidity, gas and MEV assumptions |
A simple rule works well: the faster the strategy trades, the more granular the data should be.
Free And Paid Data Sources
Free data is often good enough for early testing, especially for large-cap spot strategies. Exchange-native data is usually the cleanest starting point when you plan to trade on that same exchange. Binance offers public market data through Binance Data Collection, while Coinbase provides candle endpoints through its market data API documentation.
Aggregator APIs are convenient when you need broad coverage across many assets. CoinGecko's API includes OHLC endpoints and historical market data endpoints, which can be useful for research, dashboards and early strategy screening.
Paid institutional datasets become relevant when the strategy depends on clean trade data, order book snapshots, derivatives history, cross-exchange comparisons or long archives. They are overkill for many beginners, but serious short-term systems need better data than a quick CSV download from a random site.
The data source should be recorded in the backtest notes. If the strategy later moves to Binance, testing on a blended aggregator price may hide exchange-specific spreads, outages, listing dates and liquidity gaps.
Data Cleaning Checklist
Dirty data can quietly ruin a backtest. Before running the test, check:
- Consistent timezone
- Missing candles
- Bad ticks or obvious price spikes
- Duplicate rows
- Delisted assets
- Exchange-specific symbols
- USDT, USDC or fiat quote currency changes
- Token migrations or contract swaps
- Unrealistic start and end dates
- Assets that did not exist during the full test period
- Candles with zero or suspicious volume
- Mismatched data between spot and futures markets
Survivorship bias is common in crypto. Testing only the altcoins that survived until today ignores the coins that collapsed, lost liquidity, migrated, were delisted or faded into chart graveyards. That can make an altcoin strategy look cleaner than reality.
Step 3: Pick A Backtesting Method Or Tool
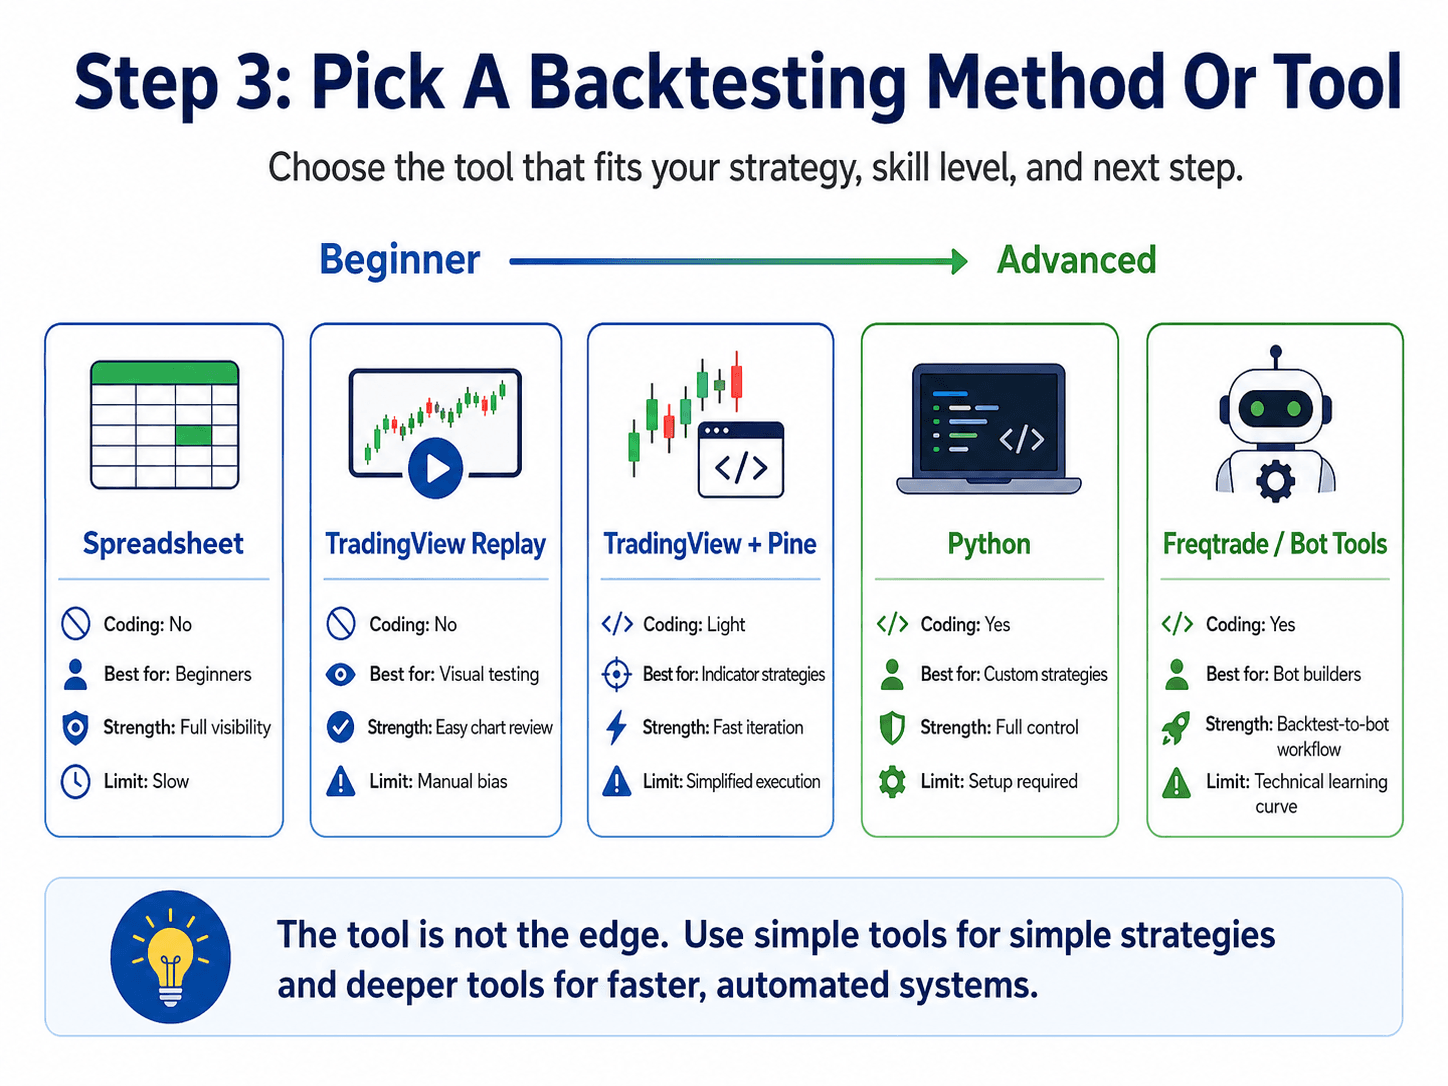
The best backtesting tool depends on the strategy, the trader and the next step. A beginner testing daily swing rules does not need a custom Python stack on day one. A bot builder preparing exchange execution probably should not rely on visual replay alone.
For market screens, charting and data dashboards, crypto analysis tools can help you decide whether TradingView, CoinGecko, Glassnode, Nansen or another platform belongs in your workflow.
The tool is not the edge. The tool simply decides how clearly you can test the edge.
 Picking The Right Tool For Crypto Strategy Testing
Manual Backtesting
Manual backtesting means scrolling or replaying historical charts and recording trades by hand. TradingView’s Bar Replay is one of the most accessible ways to do this because it lets traders replay historical market conditions visually.
Manual testing works well for beginners and discretionary traders. It forces you to watch how the setup forms, how often fakeouts appear, and how uncomfortable the drawdowns feel.
The weakness is bias. A trader can accidentally skip ugly signals, treat unclear entries too generously, or stop testing after a profitable run. Manual backtesting needs a trade log and fixed rules before the replay starts.
No-Code Crypto Backtesting Tools
No-code tools are useful for traders who want to test crypto trading bots, grid systems, DCA logic or simple indicator rules without writing code.
They usually provide a cleaner user flow: choose asset, choose exchange, define parameters, run the simulation and inspect results. The trade-off is hidden assumptions. Some tools simplify fees, assume perfect fills, use limited exchange data, or make it hard to model partial fills. Pricing tiers can also influence what data, timeframes or exports are available.
No-code tools are best treated as a screening layer. If the strategy only works under friendly platform assumptions, it probably needs deeper testing before going anywhere near live funds.
TradingView And Pine Script
TradingView works well for chart-based strategies using indicators such as moving averages, RSI, MACD, Bollinger Bands, volume filters and breakout levels. Pine Script lets users convert chart logic into a strategy and test it through TradingView’s Strategy Tester.
TradingView also lets users adjust strategy properties such as initial capital, order size, commission, slippage and margin in the strategy settings. That is useful, but only if the trader actively changes those settings instead of accepting defaults.
The main weaknesses are repainting indicators, bar-close assumptions and simplified execution. If a signal appears only after a candle closes, entering at that same candle close may be unrealistic unless the execution logic is specifically designed for it.
Python Backtesting
Python is the better route when a trader needs control. It is useful for custom data, multi-asset testing, portfolio rules, custom fees, slippage models and repeatable research.
Backtesting.py is a Python framework for testing strategies on historical data. Backtrader is a broader Python framework for backtesting and trading, with more infrastructure and a longer learning curve. Both can work well for traders who want reproducible tests instead of screenshots and hand-written notes.
Python also makes it easier to export trades, run parameter sweeps, compare benchmarks and re-run the same test after changing one assumption.
Freqtrade And Bot Frameworks
Freqtrade sits closer to automation, the documentation describes it as a free, open-source crypto trading bot written in Python with backtesting, plotting and money management tools. Its backtesting documentation is especially useful for traders who want a path from research to bot execution.
This makes Freqtrade more practical for users who are building rule-based spot or futures bots rather than one-off chart studies. It can help test strategy logic, download data, run dry modes and prepare for exchange integration.
Bot builders should read our crypto trading bot mistakes guide before connecting exchange APIs to live capital.
Crypto Backtesting Tool Comparison Table
| Method | Coding Needed? | Best For | Strength | Main Limitation |
|---|---|---|---|---|
| Spreadsheet | No | Beginners | Full visibility | Slow |
| TradingView Replay | No | Visual testing | Easy chart review | Manual bias |
| TradingView Pine | Light | Indicator strategies | Fast iteration | Pine and execution limitations |
| No-code bot tools | No | Bot users | Easy automation | Platform assumptions |
| Python | Yes | Custom strategies | Full control | Setup required |
| Freqtrade | Yes | Bot builders | Backtest-to-bot workflow | Technical learning curve |
The right tool is the one that gives enough realism for the strategy being tested. A daily BTC trend strategy can start simple, a leveraged five-minute altcoin strategy cannot.
Step 4: Add Fees, Slippage And Realistic Crypto Execution
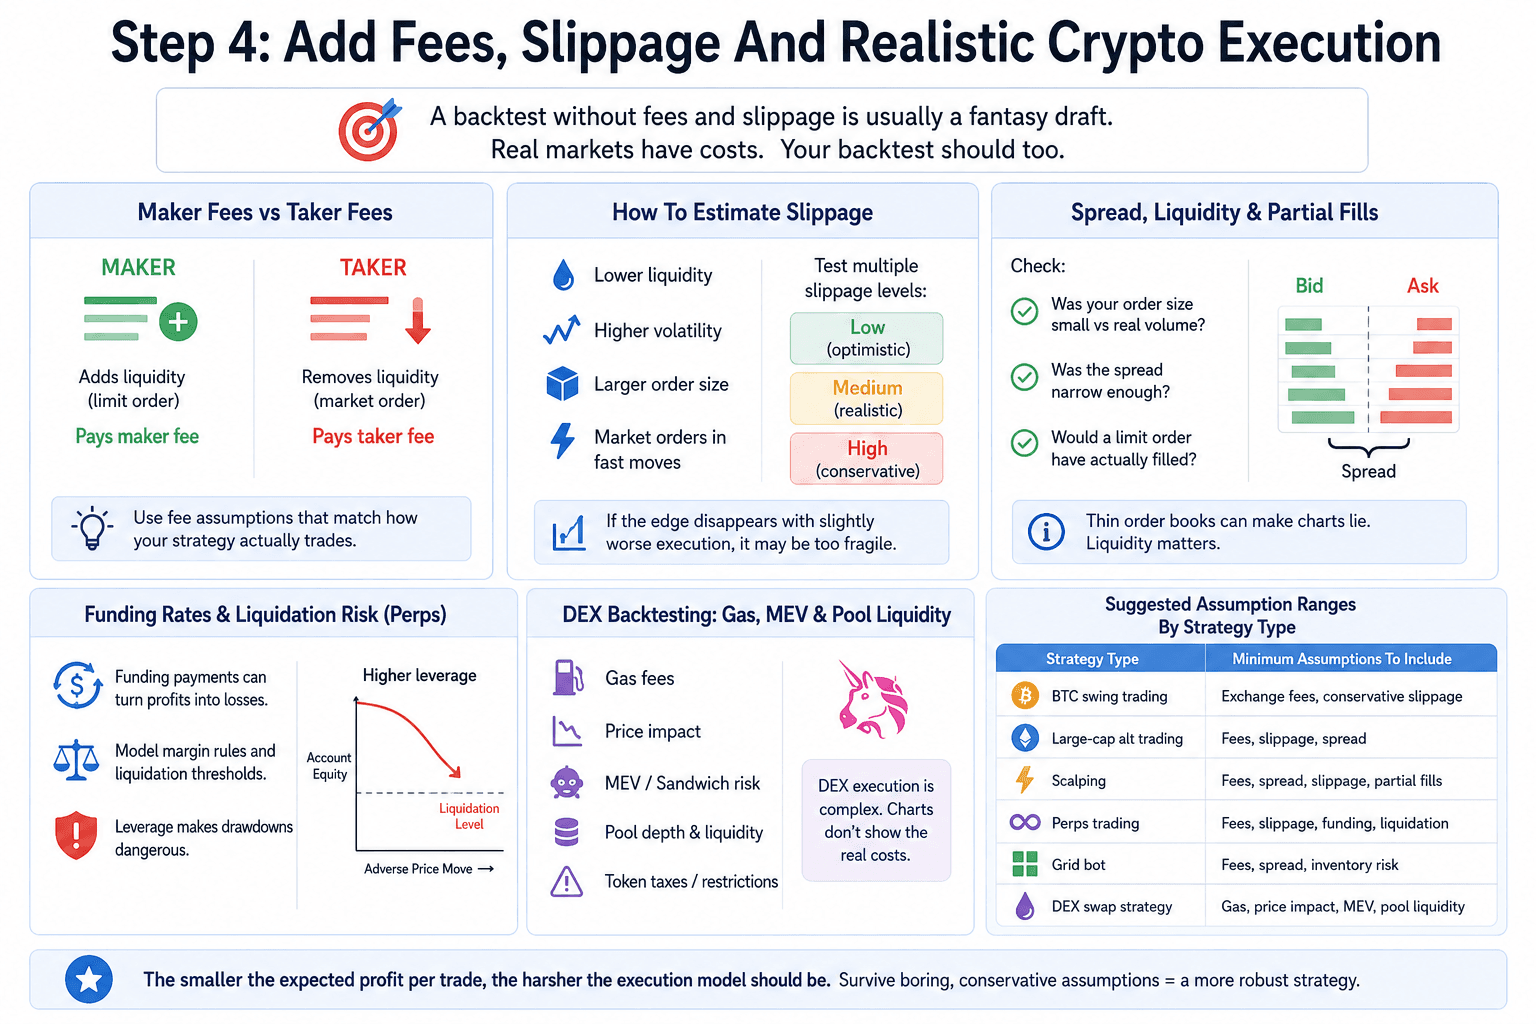
A backtest without fees and slippage is usually a fantasy draft. The strategy may look profitable on paper because the model assumes every order fills at the displayed candle price with no friction. Live markets are less polite.
Crypto market structure is the lens traders need here because venue design, order type, liquidity route and settlement model all give shape to execution. Costs hit hardest when the edge is small. Scalping, grid bots, market making and high-frequency mean reversion systems can look strong before costs and ordinary after costs. Sometimes worse than ordinary.
 Factoring In Fees Slippage Liquidity And Real Execution
Maker Fees vs Taker Fees
Maker and taker fees depend on how the order interacts with the order book. A market order removes liquidity and pays the taker fee. A limit order that rests on the book may add liquidity and pay the maker fee when filled.
The correct fee assumption depends on how the strategy actually trades. A breakout strategy that uses market orders to enter quickly should not assume maker fees. A grid bot that posts limit orders may use maker fees for filled resting orders, but it should also account for missed fills and inventory risk.
A partially matched order may pay taker fees on the immediate portion and maker fees on the resting portion. That level of detail may be excessive for a beginner swing strategy, but for high-turnover systems it can decide whether the backtest survives.
How To Estimate Slippage
Slippage is the difference between the expected price and the executed price. It usually grows when liquidity is thin, volatility is high, order size is large, or the strategy uses market orders during fast moves.
BTC and ETH usually need lower slippage assumptions than thin altcoins because their books tend to be deeper. A large-cap altcoin may need moderate assumptions. A low-liquidity memecoin may need brutal assumptions, especially during breakouts, news events or liquidation cascades.
A practical approach is to test more than one slippage setting. Run the strategy with low, medium and harsh assumptions. If the edge disappears under slightly worse execution, the strategy may be too fragile.
Spread, Liquidity And Partial Fills
A backtest should not assume every trade fills perfectly at the candle close. Real markets have a bid price, an ask price and limited size available at each level.
Three questions help:
- Would the order size have been small compared with real volume?
- Was the spread narrow enough for the strategy’s expected edge?
- Would a limit order have filled, or did the model simply assume it?
Thin order books create strange backtests. A candle may show a high, but only a tiny amount may have traded there. A model that assumes your full take-profit filled at that price may be inventing liquidity.
Partial fills are especially relevant for larger accounts and smaller coins. A $500 trade and a $50,000 trade can have very different execution even when the chart looks identical.
Funding Rates And Liquidation Risk For Perps
Perpetual futures need a separate layer of modeling. Trading fees are only one cost. Funding payments can turn a profitable strategy into a losing one if the position is held while funding repeatedly moves against it.
Crypto futures have different venue rules, contract designs and risk controls from spot markets. Margin trading adds another layer because leverage changes how quickly drawdown becomes account-threatening.
Leverage also changes the meaning of drawdown. A 10% adverse move in spot is painful. The same move at high leverage can liquidate the account before the backtest’s stop-loss logic gets a chance to work. A futures backtest should include margin rules, funding, liquidation thresholds and exchange-specific contract details wherever possible.
DEX Backtesting: Gas, MEV And Pool Liquidity
DEX strategies need a different cost model. A swap is not just “buy token, sell token.” It can involve gas fees, price impact, MEV, sandwich risk, pool depth and token transfer restrictions. developer documentation explains that price impact can be estimated before a swap through the Uniswap interface, but a backtest still has to decide how to model those costs historically.
DeFi execution is less forgiving than a clean OHLCV chart. The transaction may fail, the pool may move before confirmation, a bot may sandwich the trade, or the token may include transfer restrictions that do not show up in a normal candle.
Memecoin backtests are especially dangerous. A token may show huge candle gains, but the real trade may have faced shallow liquidity, high slippage, failed transactions, taxes, honeypot mechanics or bots racing every entry. A clean candle chart can hide a dirty execution path.
Suggested Assumption Ranges By Strategy Type
| Strategy Type | Minimum Assumptions To Include |
|---|---|
| BTC swing trading | Exchange fees, conservative slippage |
| Large-cap alt trading | Fees, slippage, spread |
| Scalping | Fees, spread, slippage, partial fills |
| Perps trading | Fees, slippage, funding, liquidation |
| Grid bot | Fees, spread, inventory risk |
| DEX swap strategy | Gas, price impact, MEV, pool liquidity |
The smaller the expected profit per trade, the harsher the execution model should be. A strategy that survives boring, conservative assumptions is far more interesting than one that only wins under perfect fills.
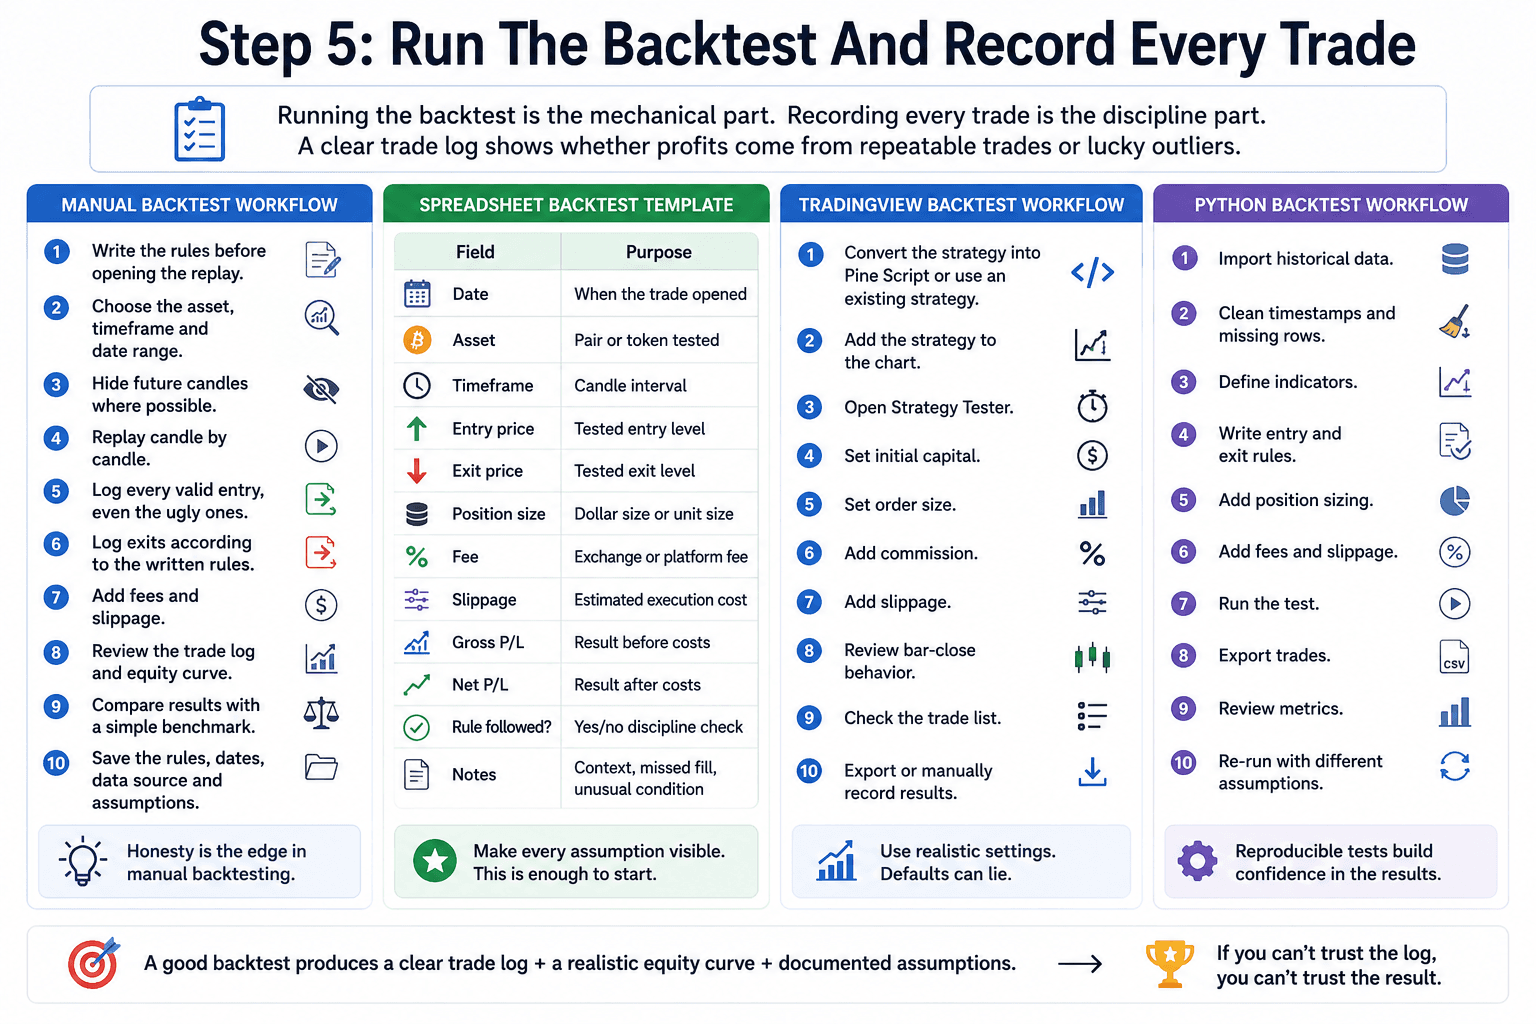
Step 5: Run The Backtest And Record Every Trade
Running the backtest is the mechanical part and recording every trade is the discipline part. If the strategy cannot produce a clear trade log, the result is hard to trust. A serious trade log gives the trader something to inspect after the equity curve. It shows whether the system made money through many repeatable trades or through a few lucky outliers.
For traders building a research stack around charting, data and journaling, our crypto research tools guide can help separate chart platforms, onchain dashboards and derivatives data instead of forcing one tool to do everything.
 Factoring In Fees Slippage Liquidity And Real Execution
Manual Backtest Workflow
A manual backtest should be slow enough to prevent hindsight from leaking into the result.
- Write the rules before opening the replay.
- Choose the asset, timeframe and date range.
- Hide future candles where possible.
- Replay candle by candle.
- Log every valid entry, even the ugly ones.
- Log exits according to the written rules.
- Add fees and slippage.
- Review the trade log and equity curve.
- Compare results with a simple benchmark.
- Save the rules, dates, data source and assumptions.
Manual testing is not inferior just because it is simple. It is often the best first test for discretionary chart ideas. The weakness is that honesty must be enforced by the trader.
Spreadsheet Backtest Template
A spreadsheet is useful because it makes every assumption visible. A clean template should include:
| Field | Purpose |
|---|---|
| Date | When the trade opened |
| Asset | Pair or token tested |
| Timeframe | Candle interval |
| Entry price | Tested entry level |
| Exit price | Tested exit level |
| Position size | Dollar size or unit size |
| Fee | Exchange or platform fee |
| Slippage | Estimated execution cost |
| Gross P/L | Result before costs |
| Net P/L | Result after costs |
| Rule followed? | Yes/no discipline check |
| Notes | Context, missed fill, unusual condition |
For beginners, this is enough. You do not need a complex dashboard before proving that the rules are even coherent.
TradingView Backtest Workflow
A TradingView backtest usually starts by converting the strategy into Pine Script or using an existing strategy script. After that:
- Add the strategy to the chart.
- Open Strategy Tester.
- Set initial capital.
- Set order size.
- Add commission.
- Add slippage.
- Review bar-close behavior.
- Check the trade list.
- Export or manually record results.
- Test different assets and market regimes.
Python Backtest Workflow
A Python workflow does not need to be complicated at first.
- Import historical data.
- Clean timestamps and missing rows.
- Define indicators.
- Write entry and exit rules.
- Add position sizing.
- Add fees and slippage.
- Run the test.
- Export trades.
- Review metrics.
- Re-run with different assumptions.
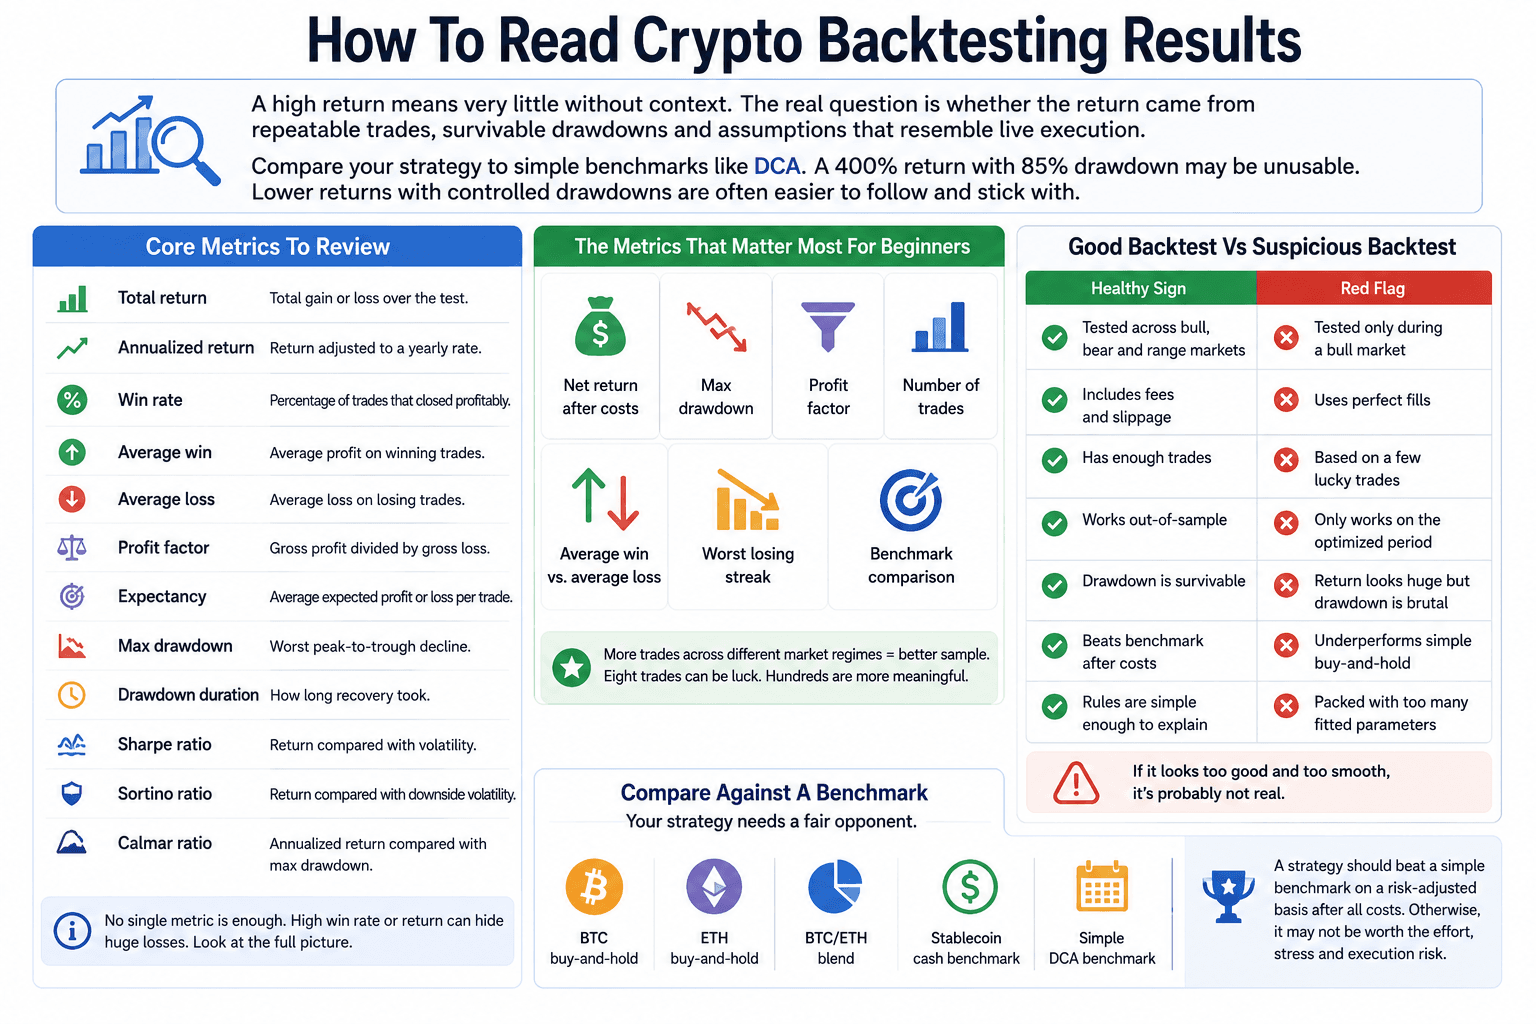
How To Read Crypto Backtesting Results
A high return means very little without context. The real question is whether the return came from repeatable trades, survivable drawdowns and assumptions that resemble live execution. Dollar-cost averaging is a useful benchmark for many traders because a complex strategy should justify the extra effort, stress and execution risk compared with a simple scheduled buying plan.
A backtest with 400% return and 85% drawdown may be unusable for most traders. A slower strategy with lower returns and controlled drawdowns may be far easier to follow.
 Separating Useful Results From Misleading Strategy Metrics
Core Metrics To Review
The main metrics are:
- Total return: Total gain or loss over the test
- Annualized return: Return adjusted to a yearly rate
- Win rate: Percentage of trades that closed profitably
- Average win: Average profit on winning trades
- Average loss: Average loss on losing trades
- Profit factor: Gross profit divided by gross loss
- Expectancy: Average expected profit or loss per trade
- Max drawdown: Worst peak-to-trough decline
- Drawdown duration: How long recovery took
- Sharpe ratio: Return compared with volatility
- Sortino ratio: Return compared with downside volatility
- Calmar ratio: Annualized return compared with max drawdown
No single metric is enough. Win rate can be high while the strategy still loses money if losses are much larger than wins. Total return can look strong while drawdown is emotionally impossible.
The Metrics That Matter Most For Beginners
Beginners should focus on fewer numbers:
- Net return after costs
- Max drawdown
- Profit factor
- Number of trades
- Average win versus average loss
- Worst losing streak
- Benchmark comparison
The number of trades is underrated. A strategy tested on eight trades may be luck wearing a lab coat. A strategy with hundreds of trades across different regimes gives a better sample, though even that does not remove future uncertainty.
Good Backtest vs Suspicious Backtest
| Healthy Sign | Red Flag |
|---|---|
| Tested across bull, bear and range markets | Tested only during a bull market |
| Includes fees and slippage | Uses perfect fills |
| Has enough trades | Based on a few lucky trades |
| Works out-of-sample | Only works on the optimized period |
| Drawdown is survivable | Return looks huge but drawdown is brutal |
| Beats benchmark after costs | Underperforms simple buy-and-hold |
| Rules are simple enough to explain | Packed with too many fitted parameters |
A suspicious backtest often looks too clean. Real strategies usually have dead zones, losing streaks and market conditions where they struggle.
Compare Against A Benchmark
A strategy needs a fair opponent. In crypto, useful benchmarks include:
- BTC buy-and-hold
- ETH buy-and-hold
- A simple BTC/ETH blend
- A stablecoin cash benchmark
- A simple DCA benchmark
A long-only altcoin strategy should not be celebrated just because it made money during a strong bull market. If buying and holding BTC or ETH delivered a better risk-adjusted result with less effort, the strategy may not justify its complexity.
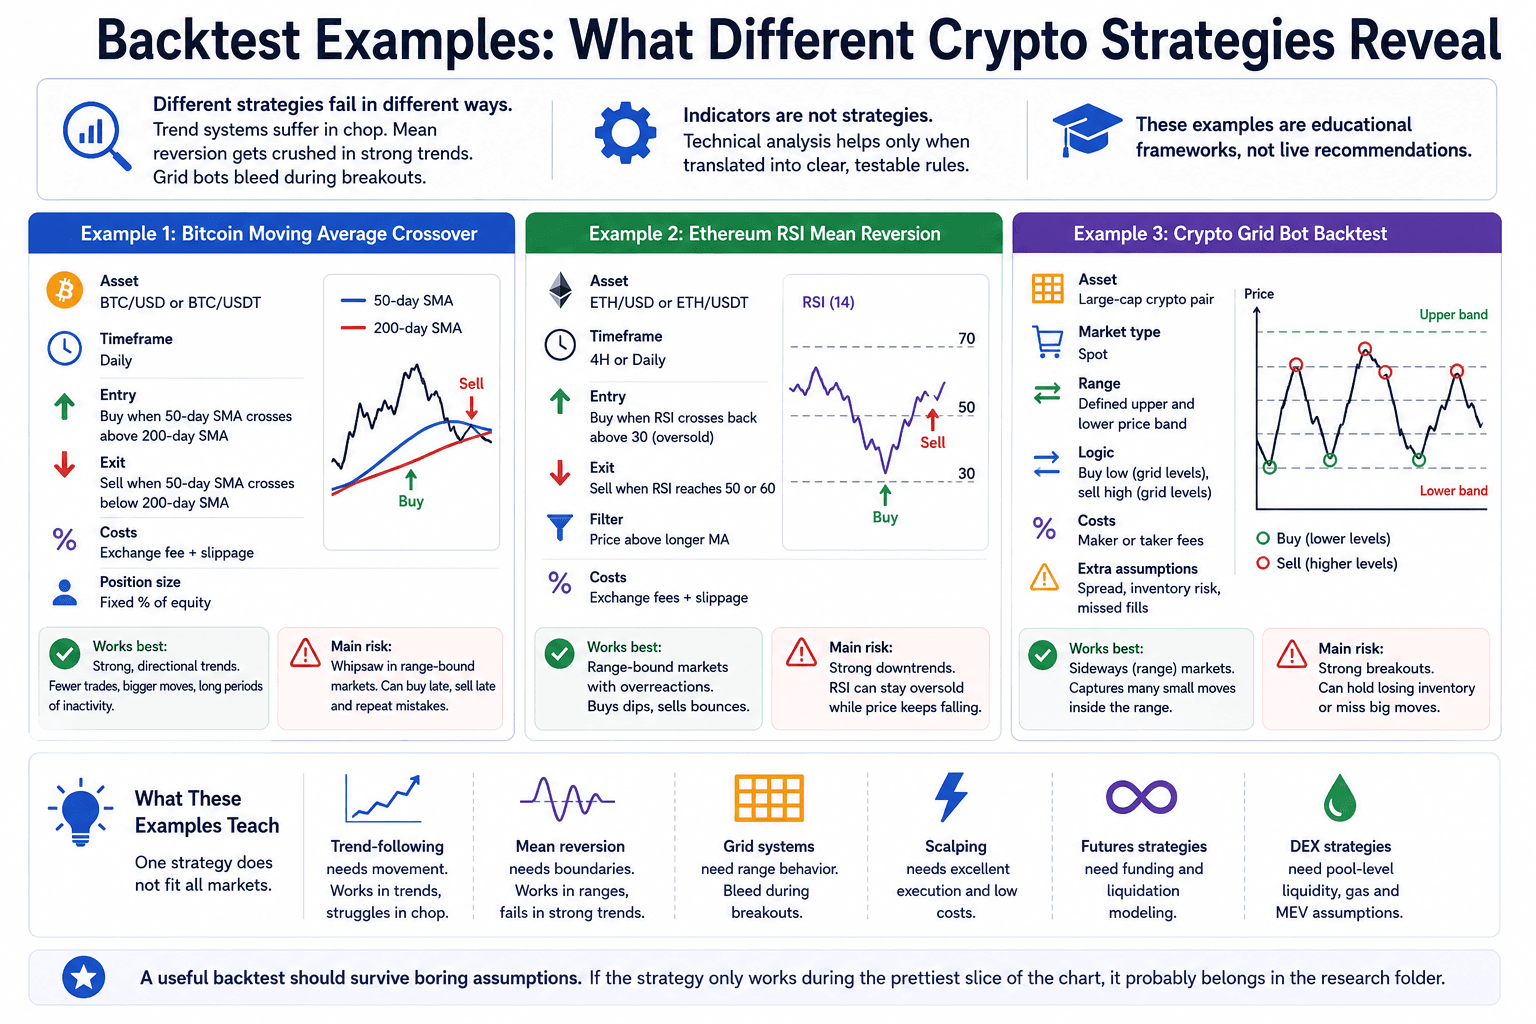
Backtest Examples: What Different Crypto Strategies Reveal
Examples help because different strategies fail in different ways. Trend systems usually suffer during chop. Mean reversion systems can get crushed during strong trends. Grid bots can bleed during breakouts. This is where technical analysis becomes useful only if it is translated into rules. An indicator by itself is not a strategy. A tested rule set is closer.
These examples are educational frameworks, not live recommendations.
 How Different Strategies Behave Across Market Conditions
Example 1: Bitcoin Moving Average Crossover
A simple Bitcoin moving average crossover strategy might use these rules:
- Asset: BTC/USD or BTC/USDT
- Timeframe: Daily
- Entry: Buy when 50-day SMA crosses above 200-day SMA
- Exit: Sell when 50-day SMA crosses below 200-day SMA
- Costs: Exchange fee plus conservative slippage
- Position size: Fixed percentage of equity
This type of strategy tries to capture major trends. It can work well when Bitcoin enters long directional moves and poorly when price chops around the moving averages. The backtest often shows fewer trades, larger trend captures and long periods of inactivity.
What usually breaks it is whipsaw. In range-bound conditions, the strategy may buy late, sell late and repeat the mistake several times. The backtest should be judged less by one huge bull-market capture and more by how much damage it takes during sideways years.
Example 2: Ethereum RSI Mean Reversion
An Ethereum RSI mean reversion strategy might use:
- Asset: ETH/USD or ETH/USDT
- Timeframe: 4-hour or daily
- Entry: Buy when RSI crosses back above 30 after being oversold
- Exit: Sell when RSI reaches 50 or 60
- Filter: Only trade when price is above a longer moving average
- Costs: Exchange fees and slippage
Mean reversion strategies try to buy temporary weakness and sell the rebound. They often look good in range-bound markets because price repeatedly snaps back after overreaction.
They can fail badly in strong downtrends. RSI can stay oversold while price keeps falling. That is why filters matter. A trend filter, volatility filter or market structure filter may reduce the number of trades but help avoid catching every falling knife.
Example 3: Crypto Grid Bot Backtest
A grid bot backtest might use:
- Asset: Large-cap crypto pair
- Market type: Spot
- Range: Defined upper and lower price band
- Logic: Buy at lower grid levels, sell at higher grid levels
- Costs: Maker or taker fees depending on order behavior
- Extra assumptions: Spread, inventory risk and missed fills
Grid bots tend to look strongest in sideways markets because they monetize repeated movement inside a range. They struggle when price trends hard in one direction.
If price breaks down, the bot may accumulate a losing inventory. If price breaks upward and leaves the grid, the bot may sit underexposed while the market runs.
What These Examples Teach
The lesson is simple: one strategy does not fit all markets.
Trend-following needs movement, Mean reversion needs boundaries. Grid systems need range behavior. Scalping needs excellent execution. Futures strategies need funding and liquidation modeling. DEX strategies need pool-level assumptions.
A useful backtest should survive boring assumptions. If the strategy only works during the prettiest slice of the chart, it probably belongs in the research folder.
The Biggest Crypto Backtesting Mistakes
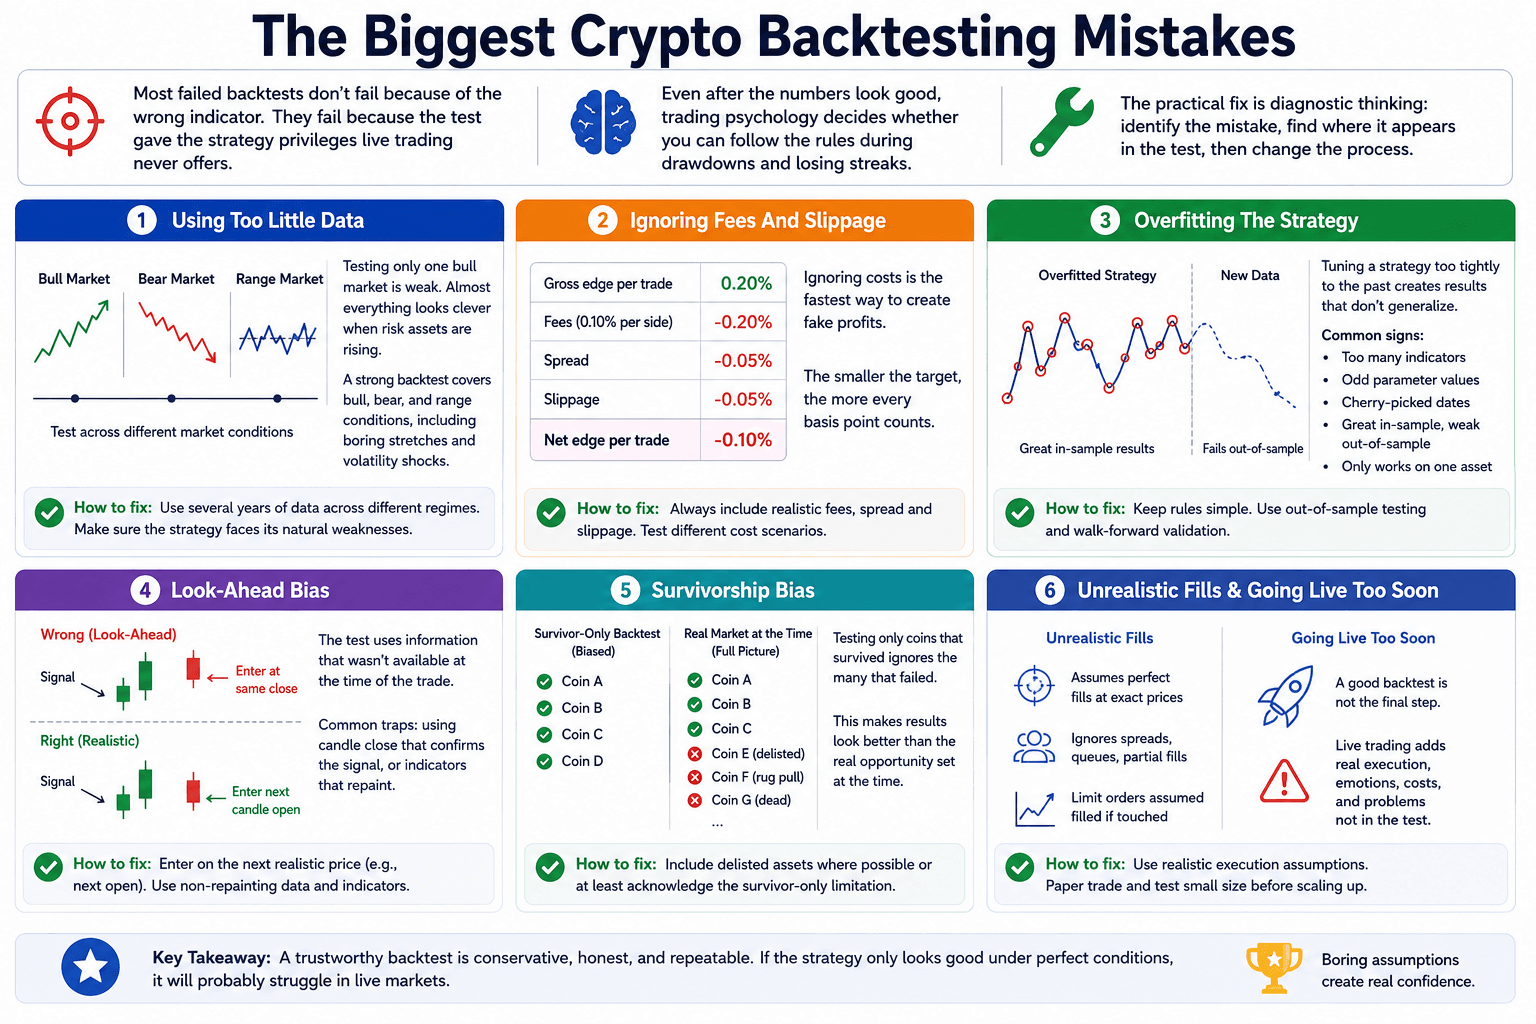
Most backtests fail because the test quietly gave the strategy privileges that live trading never offers. Even after the numbers look good, trading psychology still decides whether the trader can follow the rules during drawdowns, missed entries and losing streaks. The fix is diagnostic thinking: identify the mistake, find where it appears in the test, then change the process.
 Common Testing Errors That Make Strategies Look Better
Using Too Little Data
Testing only one bull market is weak. Almost everything looks clever when liquidity is expanding and risk assets are rising.
A stronger backtest covers bull, bear and range conditions. It should include boring stretches, volatility shocks and at least one period where the strategy’s natural weakness appears. A trend strategy that has never faced chop has not been tested. A mean reversion strategy that has never faced a brutal downtrend has not been tested.
Ignoring Fees And Slippage
Ignoring costs is the fastest way to create fake profits. This is especially true for scalping, grid bots and high-turnover strategies.
A strategy that earns 0.20% per trade before costs may look excellent. Add a 0.10% fee per side, spread and slippage, and the edge may disappear. The smaller the trade target, the more every basis point counts.
Overfitting The Strategy
Overfitting happens when a strategy is tuned too tightly to the past. The trader keeps adding indicators, filters and parameters until the historical result looks impressive. Then the strategy meets new data and collapses.
Common signs include:
- Too many indicators
- Oddly specific parameter values
- Cherry-picked start and end dates
- Great in-sample results and poor out-of-sample results
- Strong performance on one asset but failure everywhere else
Simple rules are not automatically better, but they are easier to distrust productively. If the logic cannot be explained in plain English, the backtest may be curve fitting in disguise.
Look-Ahead Bias
Look-ahead bias means the backtest uses information that would not have been available at the time of the trade.
The candle-close trap is common. If a signal confirms only after the candle closes, the strategy usually cannot enter at that same close unless the model proves execution was possible. A safer assumption is often entry on the next candle open or the next realistic tradable price.
Indicators that repaint create a similar problem. They may show beautiful historical signals that were not actually visible in real time.
Survivorship Bias
Survivorship bias appears when the backtest only includes assets that survived.
Crypto has thousands of dead coins. Many lost liquidity, were delisted, migrated, rugged, faded or became impossible to trade at meaningful size. If an altcoin strategy tests only today’s winners, it ignores the tokens that would have hurt the account along the way.
A better test either includes delisted assets where possible or limits the claim. A backtest on today’s top coins is a test on today’s survivors, not the full opportunity set that existed at the time.
Unrealistic Fills
Unrealistic fills make a strategy look cleaner than it is. A model may assume that every stop-loss, take-profit and limit order filled at the exact historical price. Real orders face spreads, queues, partial fills and fast markets.
Market orders should usually receive worse execution assumptions than ideal candle prices. Limit orders should not be assumed to fill simply because the candle touched the level. Thin books need harsher assumptions.
Going Live Too Soon
A strong backtest is not the final step. It is an invitation to validate.
Many traders go live too soon because the equity curve gives them confidence. Then live execution introduces missed trades, worse fills, emotional rule-breaking, API issues, funding costs and market conditions that were not in the test sample.
Paper trading and small-size live testing exist to expose those problems before the account size gets meaningful.
How To Validate A Crypto Strategy Before Going Live
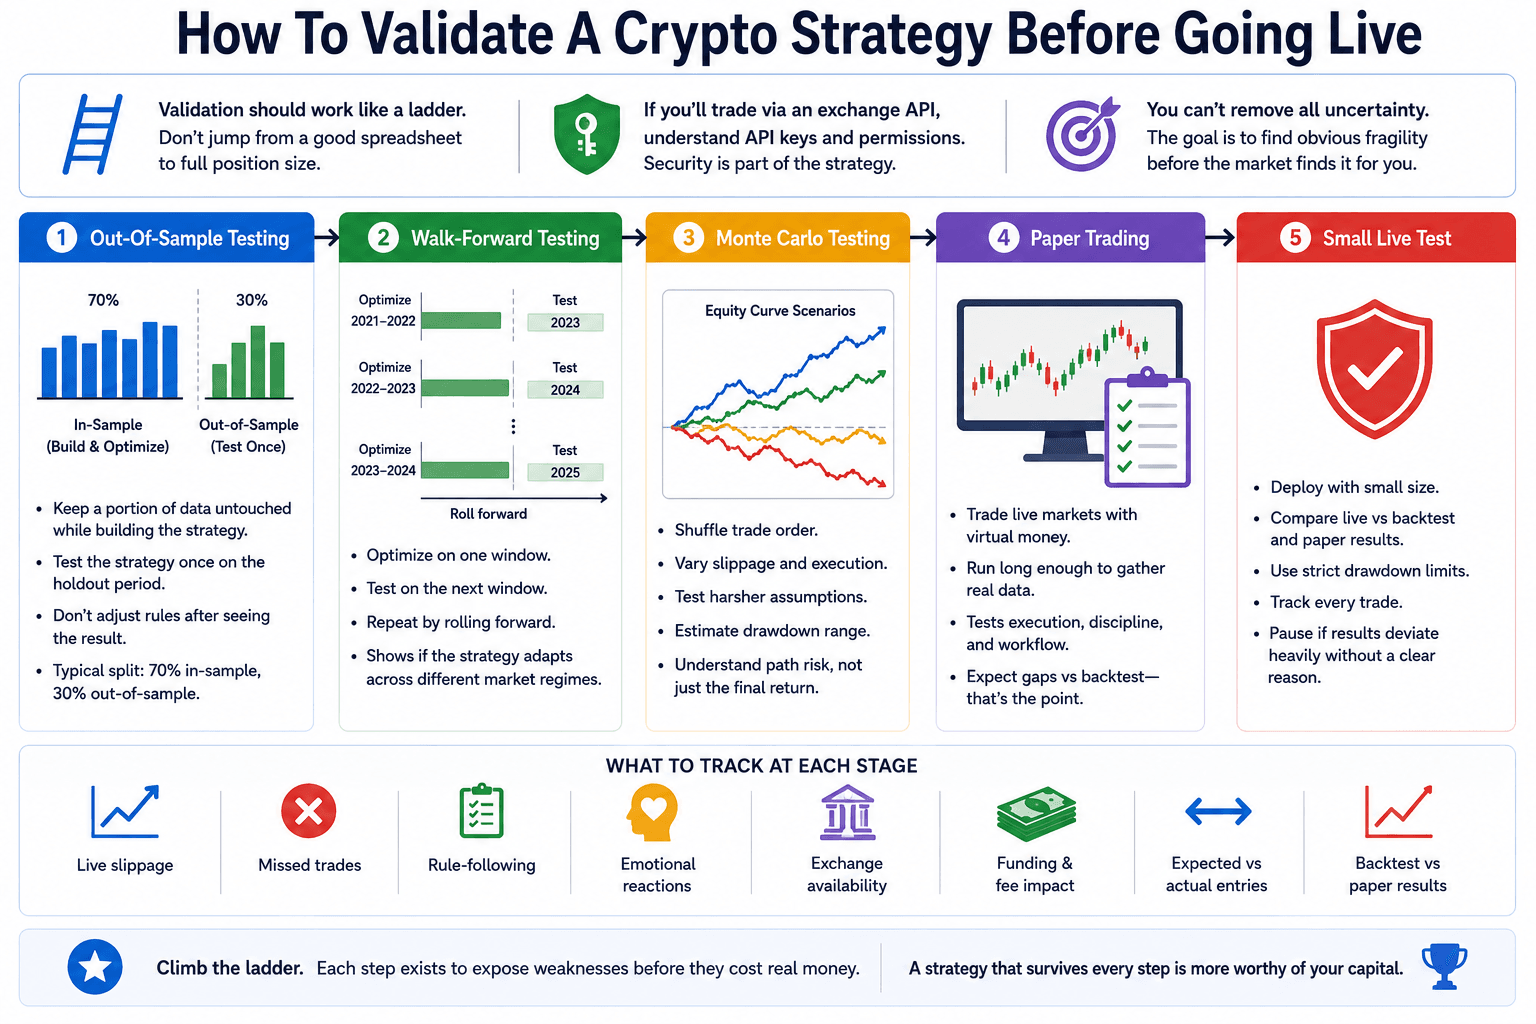
Validation should work like a ladder. A strategy climbs from backtest to out-of-sample testing, then walk-forward or stress testing, then paper trading, then small live deployment. It should not jump from a good spreadsheet to full position size.
 Testing Strategy Strength Before Real Capital Enters
Out-Of-Sample Testing
Out-of-sample testing means keeping part of the data untouched while designing the strategy. The trader builds and adjusts the strategy on one period, then tests it once on the untouched period.
The key word is once. If you keep adjusting the rules after seeing the holdout result, the holdout period becomes part of the optimization. It loses its value.
A simple split might use 70% of the data for development and 30% for out-of-sample testing. The exact split depends on the timeframe and number of trades, but the principle stays the same.
Walk-Forward Testing
Walk-forward testing is more dynamic. The strategy is optimized on one window, tested on the next window, then rolled forward.
For example:
- Optimize from 2021 to 2022.
- Test on 2023.
- Optimize from 2022 to 2023.
- Test on 2024.
- Continue rolling forward.
This helps show whether the strategy can adapt across different regimes. It is especially useful when parameters may need periodic adjustment, but it can also expose strategies that only worked because the original period was unusually friendly.
Monte Carlo Testing
Monte Carlo testing stresses the trade sequence. It can shuffle trades, vary slippage, worsen execution assumptions or simulate harsher losing streaks.
This helps answer practical questions:
- What if the worst losses arrive earlier?
- What if slippage is 50% worse?
- What if the next 100 trades are less favorable than the backtest average?
- What drawdown range should the trader prepare for?
Monte Carlo does not predict the future. It gives a rougher picture of path risk. That is useful because traders do not experience returns as a final number. They experience them one uncomfortable sequence at a time.
Paper Trading
Paper trading uses live market conditions without real money. It tests execution, discipline and operational workflow. For higher-frequency strategies, paper trading for one to three months can reveal a lot. For lower-frequency strategies, three to six months may be more useful because trades occur less often.
Track:
- Live slippage
- Missed trades
- Rule-following
- Emotional reactions
- Exchange availability
- Funding and fee impact
- Difference between expected and actual entries
- Difference between backtest and paper results
Paper trading is where many elegant backtests become ordinary. That is useful information, not failure.
Small Live Test
The first live test should be small. The goal is to compare live behavior with backtest and paper results, not to maximize profit. Use strict drawdown limits, track every trade, compare live slippage with tested assumptions. Pause if results diverge heavily without a clear explanation.
A small live test can reveal issues that paper trading misses, including emotional pressure, order book behavior, funding payments, exchange latency and hesitation around real losses.
Backtest Readiness Checklist
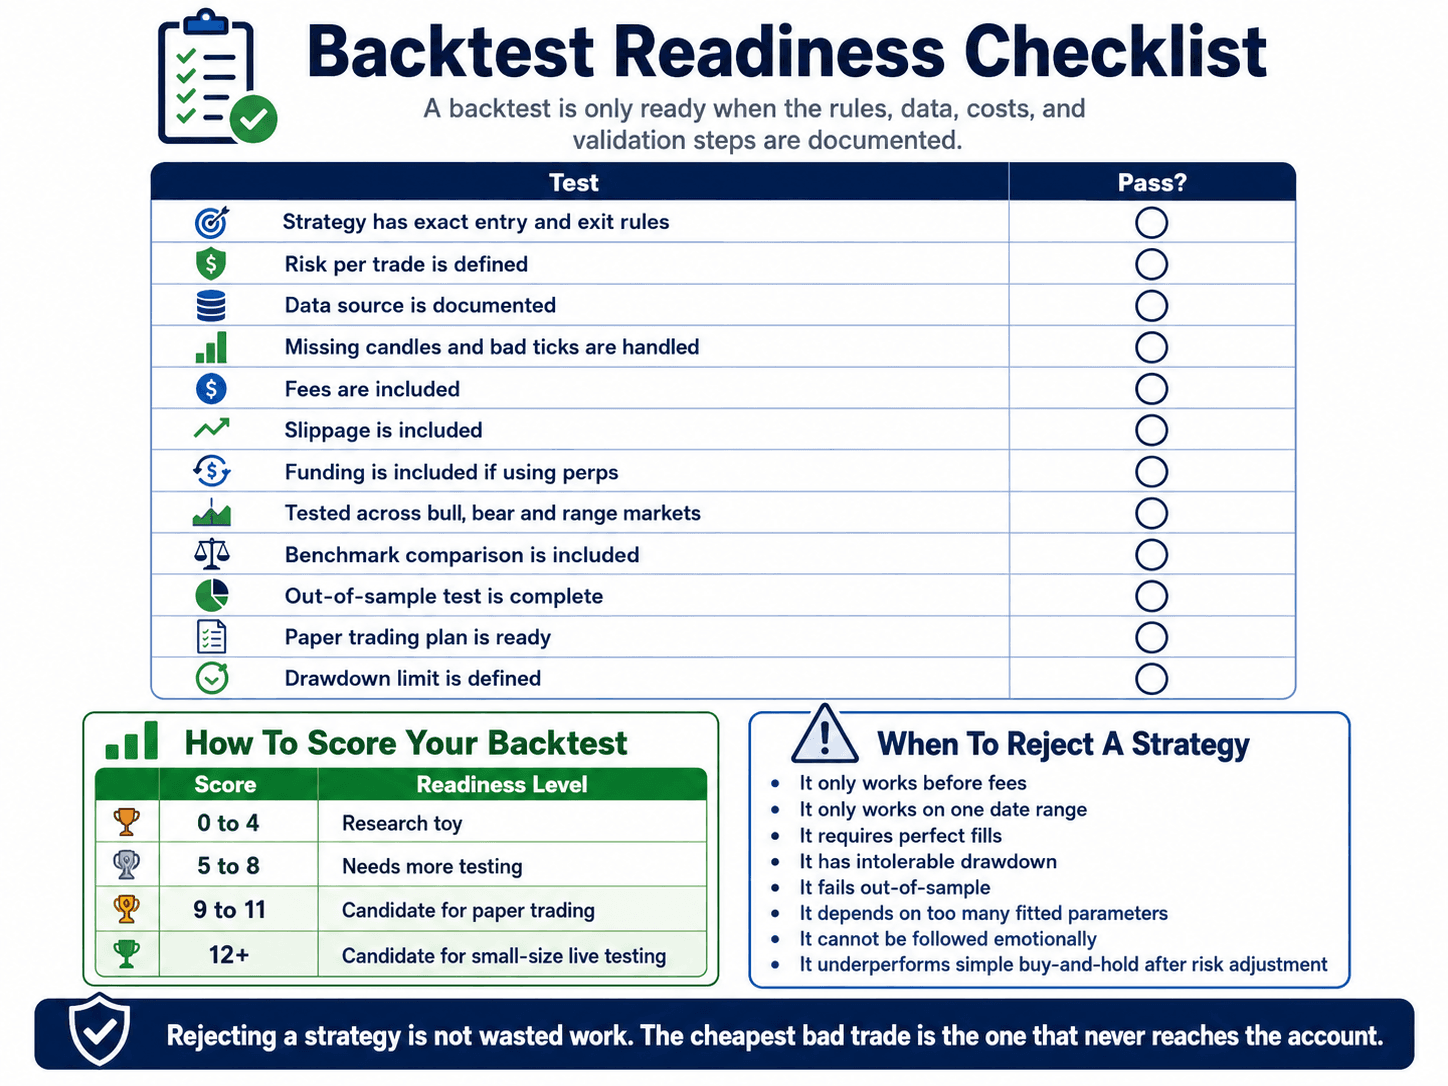
A backtest is ready for serious consideration when the rules, data, costs and validation steps are documented. If the process lives only in your head, it is probably not ready.
Before choosing the live venue, compare crypto exchanges on fees, liquidity, supported pairs, derivatives access and reliability. A strategy tested on one venue can behave differently on another.
 A Practical Scorecard For Backtest Quality Control
Use this checklist as a scorecard.
| Test | Pass? |
|---|---|
| Strategy has exact entry and exit rules | |
| Risk per trade is defined | |
| Data source is documented | |
| Missing candles and bad ticks are handled | |
| Fees are included | |
| Slippage is included | |
| Funding is included if using perps | |
| Tested across bull, bear and range markets | |
| Benchmark comparison is included | |
| Out-of-sample test is complete | |
| Paper trading plan is ready | |
| Drawdown limit is defined |
How To Score Your Backtest
Use a simple score:
| Score | Readiness Level |
|---|---|
| 0 to 4 | Research toy |
| 5 to 8 | Needs more testing |
| 9 to 11 | Candidate for paper trading |
| 12+ | Candidate for small-size live testing |
This scoring system is intentionally strict. A strategy can look profitable and still fail the readiness test because the data was weak, costs were missing or drawdown was not survivable.
When To Reject A Strategy
Reject or shelve a strategy when:
- It only works before fees
- It only works on one date range
- It requires perfect fills
- It has intolerable drawdown
- It fails out-of-sample
- It depends on too many fitted parameters
- It cannot be followed emotionally
- It underperforms simple buy-and-hold after risk adjustment
Rejecting a strategy is not wasted work, It is the backtest doing its job. Ultimately the cheapest bad trade is the one that never reaches the account.
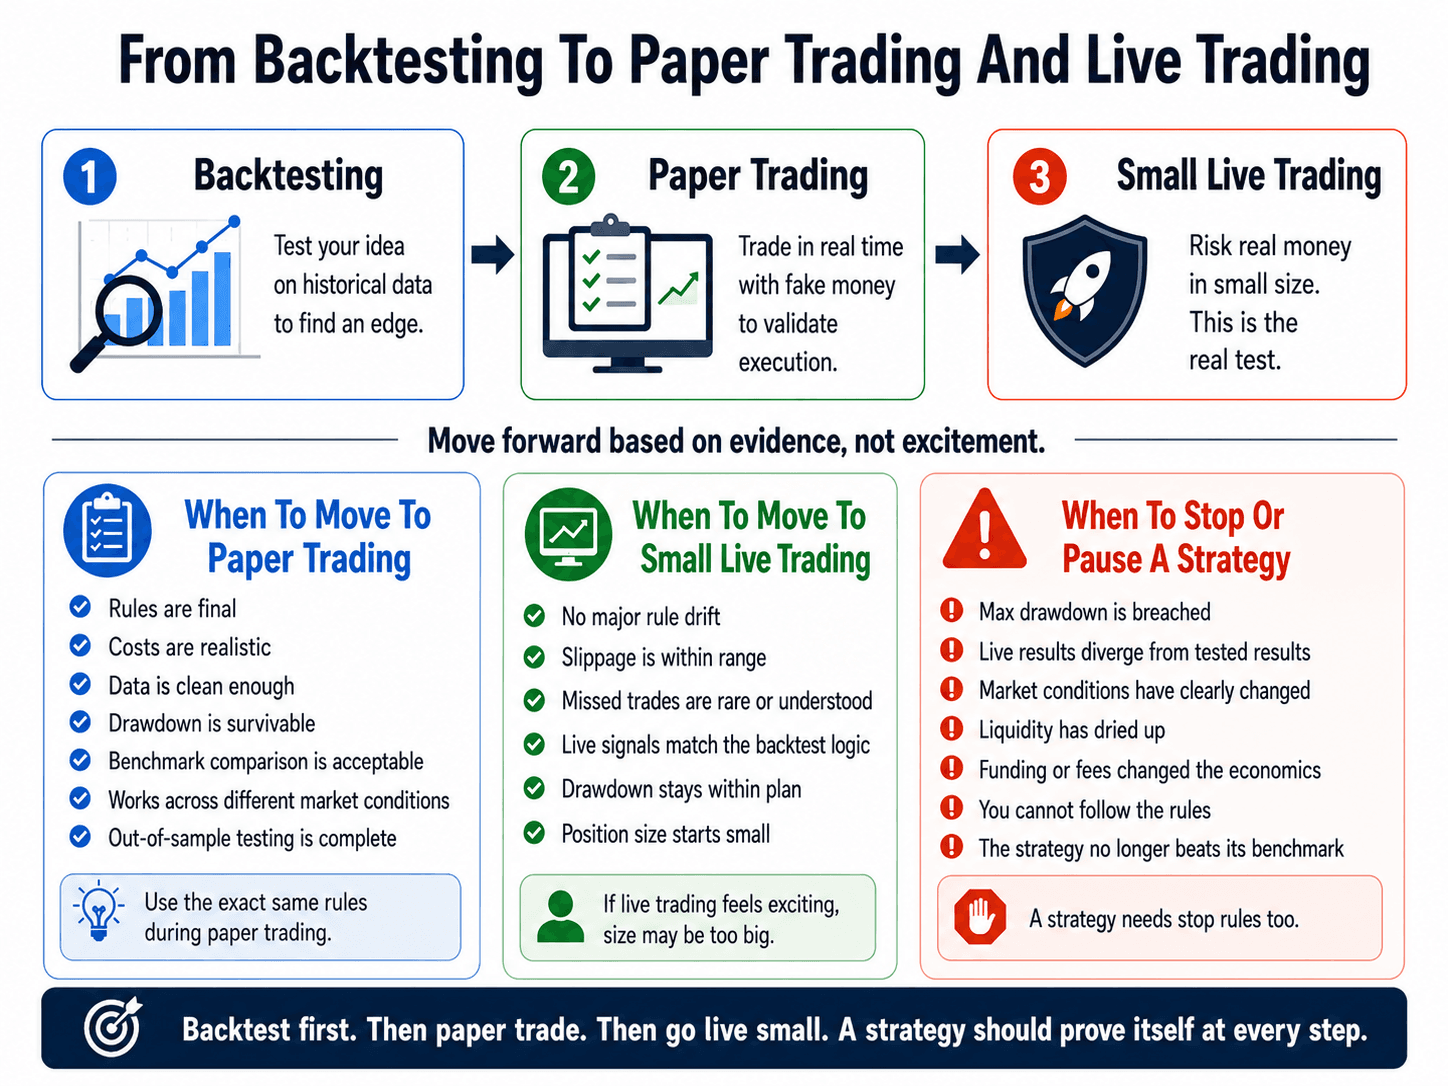
From Backtesting To Paper Trading And Live Trading
A backtest is the research layer, paper trading is the rehearsal, live trading is the real test and each stage should earn the next one.
 Moving From Research To Execution With Discipline
When To Move To Paper Trading
Move to paper trading when:
- Rules are final
- Costs are realistic
- Data is clean enough for the strategy type
- Drawdown is survivable
- Benchmark comparison is acceptable
- The strategy works across more than one market condition
- Out-of-sample testing is complete
Paper trading should follow the exact same rules as the backtest. If the trader keeps changing entries and exits during paper trading, the strategy is still discretionary and should be treated that way.
When To Move To Small Live Trading
Move to small live trading when paper trading confirms that the strategy can be executed in real market conditions.
Good signs include:
- No major rule drift
- Slippage is within expected range
- Missed trades are rare or understood
- Live signals match the backtest logic
- Drawdown remains within planned limits
- Position size starts small enough to avoid emotional distortion
The first live phase should be boring. If it feels exciting, the size is probably too large.
When To Stop Trading A Strategy
A strategy should have stop rules just like a trade has stop rules.
Stop or pause when:
- Max drawdown is breached
- Live results diverge heavily from tested results
- Market conditions have clearly changed
- Liquidity has dried up
- Funding or fees have changed the economics
- The trader cannot follow the rules
- The strategy no longer beats

Final Verdict: A Good Crypto Backtest Is A Filter, Not A Forecast
A good crypto backtest helps traders reject weak ideas before real capital is at risk. It can show whether a strategy had historical performance, whether drawdown was survivable, and whether the rules still made sense after fees, slippage and bad market conditions were included. What it cannot do is forecast the future. Markets change, liquidity shifts, funding rates move, traders make mistakes, and a strategy that looked clean on historical data can still struggle once it meets live execution.
The real value of backtesting is discipline. It forces a trader to define the rules before money is involved. It makes the cost of bad assumptions visible. It separates a repeatable strategy from a chart pattern that only looked obvious after the move happened.


