Which Crypto Charting App Is Best for Your Trading Style?
The best crypto charting app depends more on how you trade than on which platform has the longest feature list. A beginner checking spot prices has very different needs from a scalper watching order flow or a derivatives trader monitoring perpetual futures.
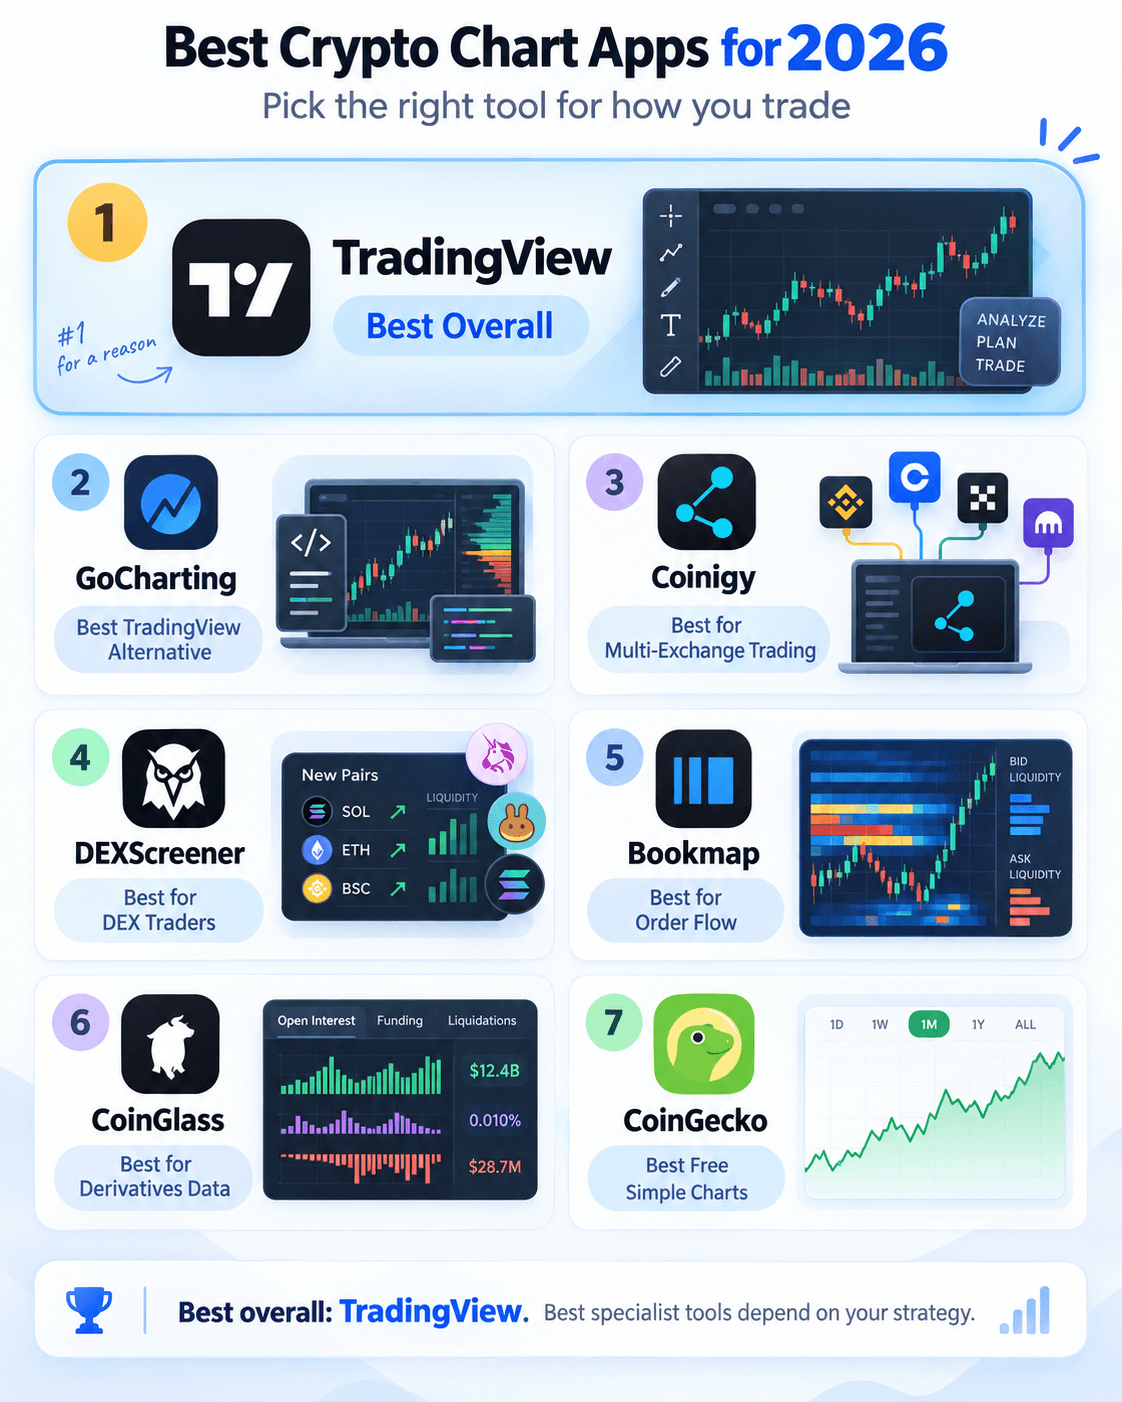
| Trading Style | Best Fit | Why |
|---|
| Beginners | TradingView / CoinGecko | Easy starting point with free charting options |
| Technical analysts | TradingView | Deep general-purpose technical analysis, custom indicators and backtesting |
| TradingView switchers | GoCharting | Strong alternative with scripting and deeper order-flow tools |
| Multi-exchange traders | Coinigy | Unified charting and trading across connected exchanges |
| DEX traders | DEXScreener | Pair-level charts, liquidity and new-token discovery |
| Day traders / scalpers | Bookmap | Order flow, liquidity heatmaps and market-depth analysis |
| Derivatives traders | CoinGlass + TradingView | Technical charts plus open interest, funding and liquidation data |
| Swing traders | TradingView | Multi-timeframe analysis, alerts and Bar Replay |
For most traders, TradingView is the strongest all-round choice because it covers spot trading, technical indicators, alerts, custom scripts and strategy testing without forcing users into a highly specialized workflow.
Specialist traders may benefit more from narrower tools. DEXScreener is better suited to decentralized trading pairs and liquidity pools, while Bookmap focuses on order flow and market depth. CoinGlass adds crypto-native derivatives data such as open interest, funding rates and liquidation heatmaps, making it useful alongside TradingView for perpetual futures traders.
The key is to choose software around the data and workflow you actually use, rather than simply picking the platform with the highest indicator count.
Free vs Paid Crypto Charting Apps: What Do You Actually Get?
Free crypto charting apps are often enough for beginners and casual traders, but the useful differences show up quickly once you need more indicators, alerts, historical data or advanced analysis tools.
What the Best Free Crypto Chart Apps Include
| Platform | Free Plan Highlights | Important Free-Plan Limits |
|---|
| TradingView | Candlestick charts, technical indicators, drawing tools, watchlists, price alerts | One chart per tab, tighter indicator and alert limits, 5,000 historical bars |
| GoCharting | Real-time crypto data, 100+ indicators, Lipi scripting, Bar Replay, basic Volume Profile and Market Profile | Two charts per tab, four concurrent charts, lower workspace/device limits, advanced order flow reserved for Premium |
| Bookmap | Live crypto data, liquidity heatmap, volume dots, CVD and Volume Profile | One simultaneously viewable symbol, shorter historical-data window |
| DEXScreener | DEX charts, liquidity, volume, watchlists, alerts, Multicharts and new-pair discovery | No advanced custom scripting or full strategy backtesting |
| CoinGlass | Open interest, funding, liquidation and derivatives data | Advanced Liquidation Heatmap functionality requires Prime |
| CoinGecko | Crypto prices, historical charts, watchlists, portfolio tracking and price alerts | Limited technical-analysis tools, no custom indicators or backtesting |
Free plans work well when you mainly need price charts, basic technical indicators, watchlists and simple alerts. The limitations become more noticeable for active traders who want several charts open at once, more historical data, advanced alert conditions or specialist tools such as order flow and backtesting.
Traders who need position and performance tracking rather than technical analysis can compare the best crypto portfolio trackers instead.
When Paying for a Crypto Chart App Makes Sense
A paid subscription becomes easier to justify when charting is part of your daily trading workflow. Paid plans commonly increase the number of simultaneous indicators, charts and alerts while unlocking deeper historical data, custom timeframes, advanced alert conditions, Volume Profile, order-flow tools, replay and strategy testing.
| Platform | Consumer Pricing as of Sept. 15, 2026 |
|---|
| TradingView | Essential from $12.95/month billed annually |
| GoCharting | Free plan available; Crypto & Forex Premium price shown at checkout |
| Coinigy | Pro Trader from $18.66/month billed annually |
| DEXScreener | Core platform free |
| Bookmap | Digital free; Digital Plus $19/month or $195/year |
| CoinGlass | Prime $28/month, $78/quarter or $268/year |
| CoinGecko | Premium $10/month or $99.90/year |
For most beginners, paying immediately is unnecessary. Upgrade when the free-plan limits are actively interfering with your workflow, such as when you need more alerts, longer historical datasets, multiple chart layouts or specialist analysis tools.
Note: Developer API subscriptions are separate products. API pricing from platforms such as CoinGecko or CoinGlass should not be treated as the cost of their consumer charting plans.
Beginners who are still learning order types, trading pairs and execution can read our crypto trading guide for beginners before moving into advanced charting tools.
What to Look for in a Crypto Charting App
The best crypto charting software should fit your trading workflow, not simply advertise the largest number of indicators. Data quality, customization, alerts and crypto-specific features are often more useful than raw feature counts.
If you are still learning the basics, our guide to reading crypto charts explains candlesticks, trends, volume and common indicators step by step.
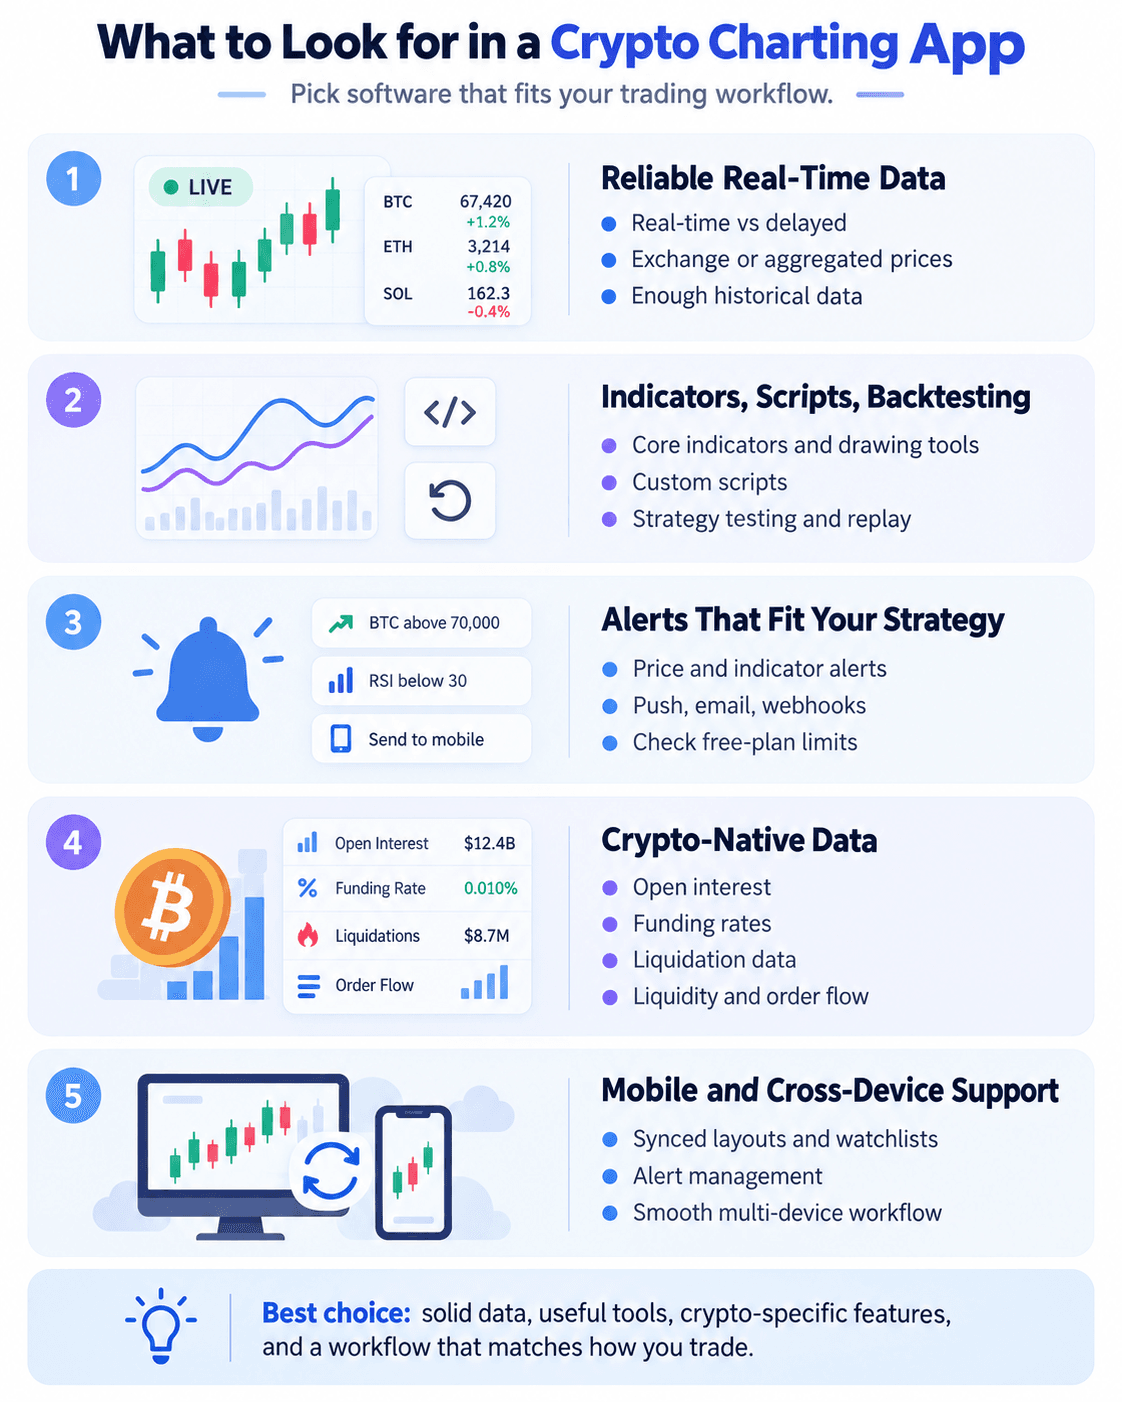
The Best Crypto Chart Apps Combine Reliable Data, Technical Tools And Features Built For Different Trading Styles
Reliable Real-Time Data
Start with the data feed. A chart may show prices from a specific exchange, such as BTC/USDT on Binance, or use aggregated prices from several markets.
Small differences between Bitcoin prices across exchanges are normal because each venue has its own order book, liquidity and trading activity. What is more important is knowing which exchange price you are analyzing and whether the feed is real-time or delayed.
Also check how much historical data the platform provides. Scalpers may care about lower timeframes and intraday history, while swing traders need enough historical depth to test setups across different market conditions.
Our crypto candlestick guide also explains why candles can differ between exchanges, trading pairs and spot or futures markets.
Indicators, Custom Scripts and Backtesting
Beginners usually need a relatively small toolkit, such as RSI, moving averages, candlestick charts and drawing tools.
Advanced traders should look beyond headline indicator counts. Custom scripts, strategy testing and Bar Replay can be more valuable than having hundreds of prebuilt indicators you never use.
Platforms such as TradingView use Pine Script for custom indicators and strategies, while other charting platforms offer their own scripting environments. Backtesting then lets traders see how a rules-based strategy would have performed against historical data, although past results do not predict future performance.
Before relying on historical results, see our guide to backtesting a crypto strategy for common problems such as overfitting, fees and slippage.
Alerts That Match Your Strategy
Alerts are especially useful in a 24/7 market because they reduce the need to constantly watch a chart.
Depending on the platform, traders may be able to create:
- Price alerts
- Technical-indicator alerts
- Drawing-tool alerts
- Volume alerts
- Watchlist alerts
- Push notifications
- Email notifications
- Webhook alerts
Check the free-plan limits carefully. Some platforms restrict the number of active alerts or reserve more advanced conditions and webhooks for paid subscriptions.
Traders new to indicators, market structure and chart patterns can start with our complete crypto technical analysis guide.
Crypto-Native Data
Traditional technical indicators only show part of the picture in crypto.
Derivatives traders may also need open interest, funding rates and liquidation data. DEX traders may care more about liquidity and pair-level volume, while short-term traders may use order flow, market depth and CVD to understand buying and selling activity.
Not every charting platform needs all of these features. The important question is whether it provides the crypto-specific data required by your trading strategy.
Traders using open interest, funding rates and liquidation data can also compare the best crypto futures trading platforms.
Mobile and Cross-Device Support
A mobile app is more useful when it preserves the workflow you built on desktop.
Look for:
- Synced chart layouts and watchlists
- Access to the same technical indicators
- Drawing-tool support
- Alert creation and management
- Direct order execution where supported
- Multi-chart functionality
- Smooth performance during volatile markets
For active traders, cross-device syncing can be particularly useful because analysis started on desktop can be monitored from a phone without rebuilding the chart from scratch.
Do You Need One Crypto Chart App or a Tool Stack?
For many traders, one platform is enough. TradingView alone can cover technical analysis, alerts, watchlists, backtesting and chart-based research across most major crypto markets.
More specialized traders may benefit from pairing a general charting platform with a second tool that adds data the first platform does not cover as deeply.
| Workflow | Suggested Setup |
|---|
| General technical analysis | TradingView |
| Technical analysis + derivatives | TradingView + CoinGlass |
| Traditional markets + DEX tokens | TradingView + DEXScreener |
| Technical analysis + order flow | TradingView or GoCharting + Bookmap |
| Multi-exchange execution | Coinigy |
A derivatives trader, for example, might use TradingView for candlestick charts and technical indicators while using CoinGlass for open interest, funding rates and liquidation data. DEX traders can use TradingView for broader technical analysis and DEXScreener for pair-level liquidity, volume and newly launched tokens.
Order-flow traders may pair TradingView or GoCharting with Bookmap when they need deeper visibility into liquidity, market depth and executed volume.
That does not mean more tools automatically produce better trading decisions. Extra platforms can also create duplicated data, more subscriptions and a noisier workflow. A second charting or analytics tool is most useful when it supplies information your main platform genuinely lacks.
For most users, it would make more sense to start with one platform and add specialist tools only when your trading strategy requires them.
Charting is only one part of market research, so traders can also compare our picks for the best crypto analysis tools across on-chain, derivatives, DeFi and sentiment data.
Are AI Crypto Charting Tools Worth Using?
AI can make crypto chart analysis faster, especially when it helps traders build indicators, summarize technical signals or test ideas. It is most useful as an assistant layered on top of reliable market data, not as a replacement for technical analysis or risk management.
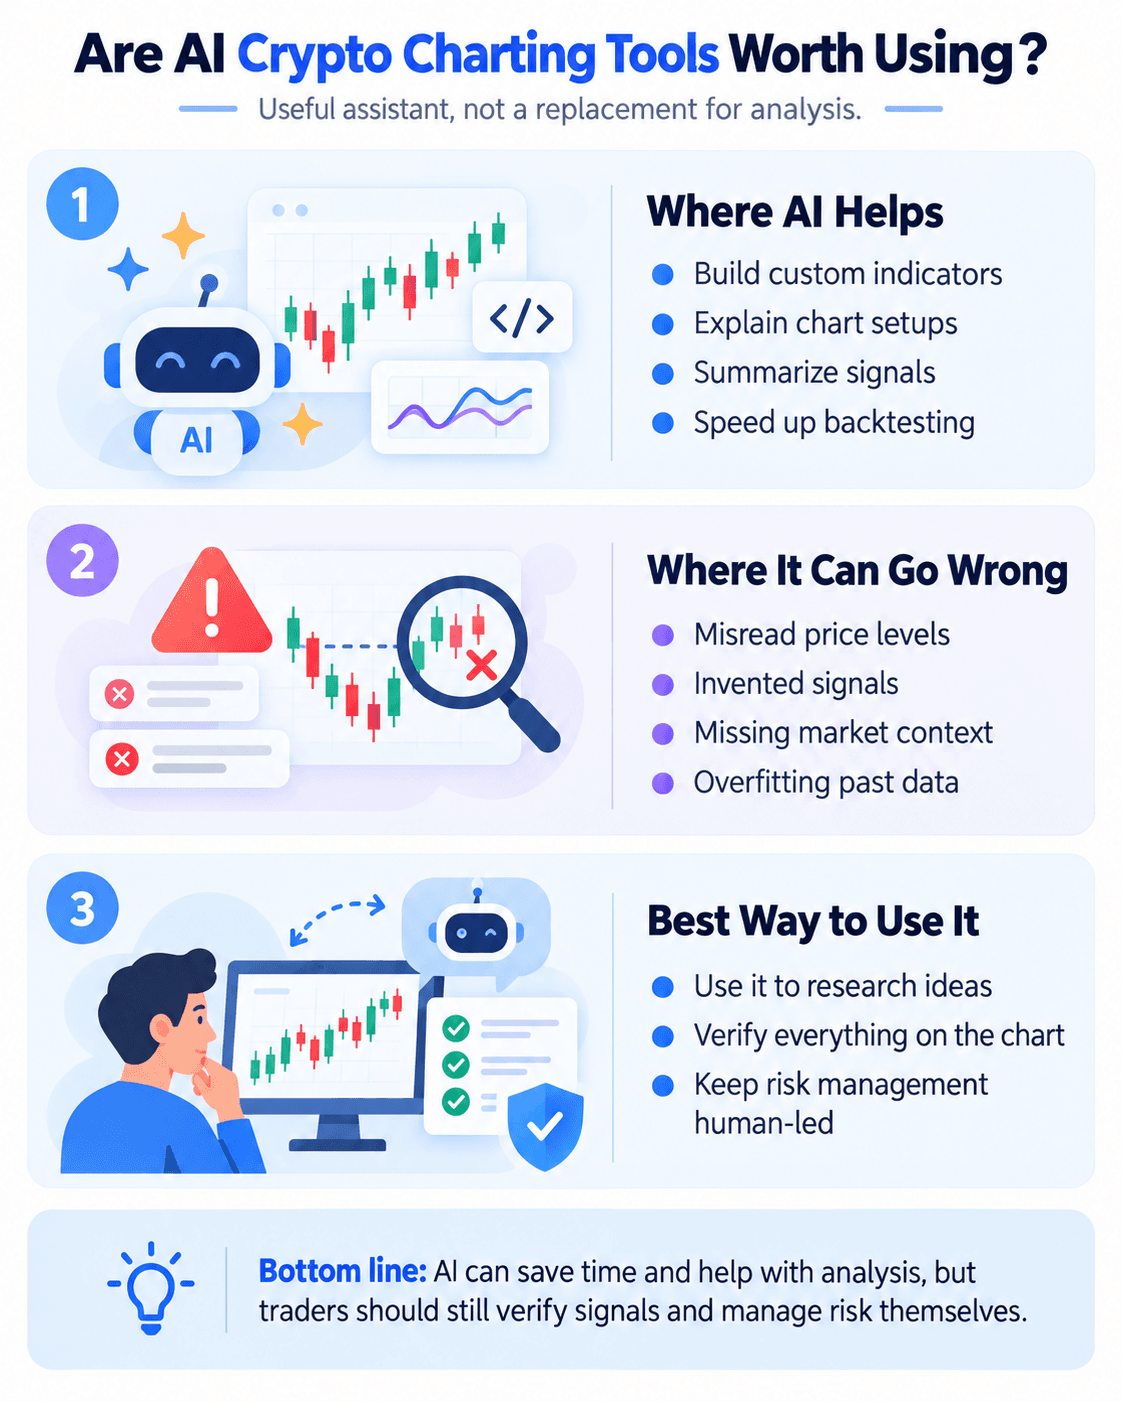
AI Can Speed Up Crypto Chart Analysis, But Traders Still Need To Verify Signals And Manage Risk Themselves
Where AI Can Help
AI tools can reduce some of the manual work involved in chart analysis. Depending on the platform, traders may use AI to:
- Generate code for a custom indicator
- Explain a chart setup or technical pattern
- Identify possible support, resistance or pattern structures
- Turn a plain-English strategy idea into rules or code
- Summarize several technical indicators
- Help structure a backtesting workflow
- Explain why a strategy produced certain historical results
This is particularly useful for traders who understand the strategy they want to test but are less comfortable writing scripts from scratch. For example, AI can help draft Pine Script or other custom code, which can then be reviewed and tested inside a charting platform.
Read our crypto risk-management strategy guide covering position size, stops and leverage.
Where AI Chart Analysis Can Go Wrong
AI output should still be verified against the actual chart and market data.
Common problems include:
- Misreading chart structure or price levels
- Inventing indicators, values or signals that are not present
- Ignoring relevant market context
- Overfitting a strategy to historical data
- Treating correlation as a reliable trading signal
- Producing confident explanations from incomplete inputs
AI-assisted backtesting also does not remove the usual problems with historical testing. A strategy can look strong because it was tuned too closely to past conditions and then fail when the market changes.
The useful way to think about AI chart analysis is as a research and workflow assistant. It can help generate ideas, explain technical analysis and speed up scripting, but it is not evidence that a trade will be profitable.
Traders interested in taking automation beyond chart analysis can also explore our comparison of the best AI crypto trading bots.




 Comparing The Best Crypto Chart Apps For Different Trading Styles In 2026