Liquidity decides whether your wins actually stick or vanish the moment you hit sell. It’s the quiet force behind smooth entries, clean exits, and real profits.
Think of this guide as your shortcut to reading any market’s “traffic conditions” before you step in, helping you avoid the traps that catch most traders off guard. By the end, you’ll know how to spot fake volume, thin books, and illiquid pairs long before they turn your screen gains into very real losses.
Quick Answer
The five most useful are bid-ask spread %, 24h trading volume, order book depth, slippage %, and CoinMarketCap Liquidity Score (0–1000). Look for spread <0.15%, volume >$1M/day, deep books within ±2%, slippage <0.5% on a $10K test, and CMC score >750. Anything worse signals rising illiquidity risk.
Why it matters: Weak liquidity increases slippage, failed exits, price manipulation risk, and the chance of getting stuck in a trade during volatility.
Fast Benchmarks
| Indicator | Healthy | Risky |
| Bid-Ask Spread | <0.15% | >0.30% |
| 24h Volume | >$1M | <$300K |
| Order Book Depth | ±2% | >±5% |
| Slippage on $10K | <0.5% | >1.5% |
| CMC Liquidity Score | >750 | <600 |
Red Flags to Watch
- Thin or vanishing order book levels beyond the top few rows
- Random volume spikes hinting at wash trading or fake activity
- Spread widening dramatically during normal trading hours
Example
SOL/USDT usually shows tight 0.02–0.05% spreads and deep books, while small-cap DEX pools can show 3–6% spreads, shallow depth, and high slippage — classic signs of illiquidity.

Liquidity in 60 Seconds
Liquidity is how easily you can buy or sell a cryptocurrency without significantly moving its price or suffering unexpected costs. It is a core pillar for anyone hoping to trade profitably in the digital asset market.
Picture two traders: Tom and Sarah. Tom purchases $5,000 of a newly released token, let’s call it “ObscureCoin,” on a little-known exchange where the daily trading volume is only $10,000. Sarah, on the other hand, buys $5,000 of Bitcoin (BTC) on Binance, which averages tens of billions in daily volume.
Tom watches ObscureCoin’s price triple in a week! His balance shows $15,000. But when he tries to sell, things take a turn. The order book isn’t deep enough; only a portion sells at the price he expects, and to liquidate the rest, he has to settle for lower and lower prices. After substantial slippage, Tom walks away with only $9,500 as his gains are evaporated by a market unable to absorb his sell order.
In contrast, Sarah’s BTC investment also triples. When she chooses to exit, her entire $15,000 sell order is filled instantly at market price, thanks to robust liquidity. She realized slippage is a mere fraction of a percent, and she gets what she expects.
Two investors, the same strategy, wildly different results, all because of liquidity.
The difference between the price you see and the price you get (slippage) is dramatically shaped by liquidity. High liquidity means you actually receive what the ticker says; low liquidity equals disappointment and unexpected costs.
More than profits, liquidity is about control and flexibility. You don’t just want paper profits, you need to know you can convert crypto to cash (or another token) quickly, and at a fair price, whenever you choose.
In illiquid markets, “profit” on-screen isn’t real if you can’t sell for those amounts. Your true P&L is what you actually receive after the market absorbs your trade. Get a better understanding of crypto trading with our beginner's guide.
TL;DR:
Tight spreads, deep order books, and high trading volume create safer environments for traders. Wide spreads, shallow books, and sporadic volume are traps even for the experienced.
The 5 Critical Indicators
Every professional trader knows that liquidity isn’t revealed by a single metric, but a holistic constellation of overlapping red and green lights. Here, we break down the five most decisive, quantifiable indicators for judging liquidity in any crypto trading pair, along with real-world thresholds and the nuance that separates a healthy market from a hidden liquidity trap.
Indicator #1 — Bid-Ask Spread (%)
The bid-ask spread is the difference between the highest price a buyer is willing to pay (bid) and the lowest price a seller is willing to accept (ask). In efficient, active markets, this difference is razor-thin—sometimes less than a hundredth of a percent for blue-chip pairs like BTC/USDT on Binance or ETH/USDT on Coinbase.
Why it matters:
The spread is your immediate, “real cost” of trading. A wide spread not only signals low liquidity, but also means you lose value on every buy or sell, even before you execute a trade.
Key thresholds:
- <0.10%: Excellent. Deep, institutional-grade liquidity.
- 0.10–0.50%: Good to moderate. Often fine for altcoins.
- 0.50–1.0%: Caution. Suitable only for small, nimble trades.
- >1.0%: Hazard. Slippage risk is high; real costs jump for all but the smallest orders.
How to check:
- Most exchanges display the live bid/ask prices above the order book.
- On CoinMarketCap, use the “Markets” tab for each token to compare spreads across venues.
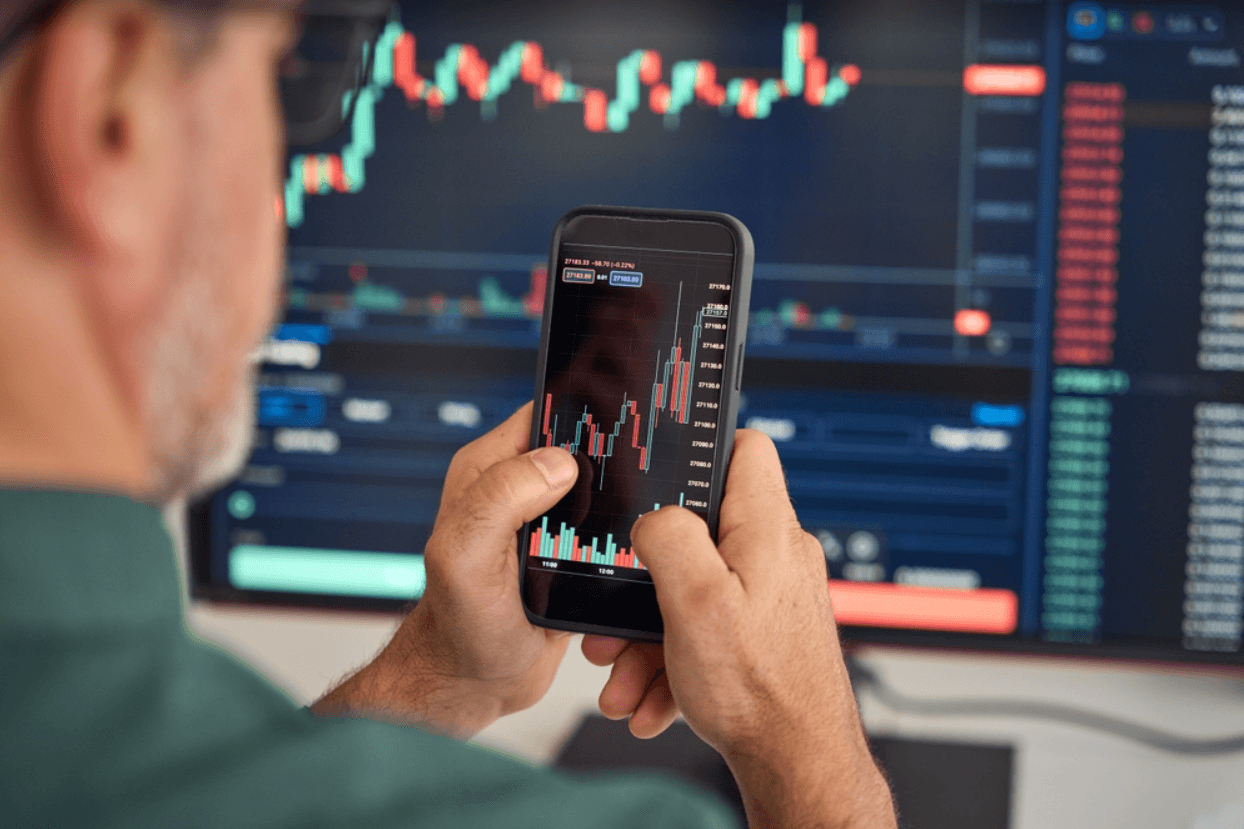 Core Indicators Every Trader Must Check First. Image via Shutterstock
Indicator #2 — 24-Hour Trading Volume
24h volume is the most widely used metric for liquidity, showing the total value of tokens transacted over the past day.
Why it matters:
High volume signals an active market with many counterparties, meaning it’s easier to both enter and exit significant positions without severely impacting the price.
Key thresholds:
- >$10M: Exceptionally safe for all retail and institutions.
- $1M–$10M: Very healthy for altcoins, safe for moderate trades.
- $100K–$1M: Minimum floor for small to moderate orders.
- <$100K: Extreme caution. Only for small, speculative trades.
Nuance—Volume/Market Cap Ratio:
A high market cap with low daily volume signals a “dead” coin or a manipulated market. Healthy daily turnover is typically 5–10% of market cap; below 1% is a red flag for thin activity.
Where to check:
- CoinMarketCap, CoinGecko: Directly on the token page.
- DEXes: DEXTools, DEX Screener for on-chain volume metrics.
Large volumes are reassuring on paper, but the order book tells you whether those volumes are accessible right now, for your size, at your price. Let’s dive into depth.
Indicator #3 — Order Book Depth
Order book depth indicates the total number of buy and sell orders within a certain percentage of the current price, revealing the amount of money “waiting” to be traded.
Why it matters:
A deep book absorbs even large orders without wild price swings. A shallow book, though, means even tiny trades can cause outsized moves—the definition of illiquidity.
Key thresholds:
- >$100K per side within ±2%: Good for midcaps and most altcoins.
- Millions per side for blue-chips (BTC, ETH).
- <$20K per side: Major danger zone for moderate order sizes.
How to check:
- On exchanges, view the live order book. Look for gaps; liquid assets have close, steady steps in size.
- On depth charts, healthy pairs display “mountain” shapes; illiquid ones have flat, sporadic, or “cliff-like” profiles.
Even with high volume and a deep book, liquidity can evaporate when it's time to execute—this is where slippage comes into play.
Indicator #4 — Slippage (%)
Slippage is the difference between the price you intend to pay (or receive) and the actual execution price. It’s the reality check every trader faces, especially in fast or thin markets.
Why it matters:
Slippage quantifies “what you actually get” versus “what you saw.” If you place a large order in an illiquid market, slippage multiplies losses by forcing you to cross the entire order book.
Key thresholds (for a $10,000 order):
- <0.10%: Institutional, nearly zero loss.
- 0.10–0.50%: Good for retail and small-cap coins.
- >0.50%: Caution on moderate or large trades. Probe first with small sizes.
How to check:
- Place a simulated order (many interfaces offer this), or use actual vs. expected price after a small live trade.
- Instead of juggling all these metrics, use composite liquidity scores for a one-glance summary.
Indicator #5 — CoinMarketCap Liquidity Score (0–1000)
CoinMarketCap distills order book depth, spread, and slippage simulations into a single liquidity score per pair per exchange, removing much legwork from your due diligence.
Why it matters:
Higher scores indicate more robust liquidity when factoring in real-world trade impact across multiple order sizes.
Key thresholds:
- 900–1000: Best of the best, large trades fill smoothly.
- 750–899: Great for all retail, reliable for moderate trades.
- 500–749: Satisfactory, but double-check for outliers.
- <500: Caution—limits required, only small trades are safe.
- <250: Very high risk, avoid unless trading negligible sizes.
How to check:
CoinMarketCap > your token > “Markets” tab, sort by “Liquidity.”
These five metrics, cross-validated in real time, separate professional diligence from retail guesswork. Our next step is to enhance due diligence with supplementary filters and on-platform walkthroughs.
Stay ahead of the market with the right set of tools for your analysis and research.
Additional Indicators
 Extra Filters That Strengthen Your Liquidity Assessment. Image via Shutterestock
Trading crypto responsibly means not only using the five critical indicators but also layering in extra filters to further minimize the possibility of being blindsided by hidden illiquidity or market manipulation. While these indicators are often considered “secondary,” they can expose subtle traps and help refine your risk assessment, especially when trading tokens outside the top 100 or venturing onto decentralized exchanges.
Market Capitalization Tiers
Market capitalization (market cap) represents the total value of all coins in circulation, calculated as price multiplied by supply. While not a direct measure of liquidity, it can still be a powerful context clue. High market cap projects (think BTC, ETH, SOL) tend to have multiple deep trading venues and institutional involvement, which keeps markets protected and responsive.
Micro-caps or nano-caps (e.g., tokens with less than $10M total market value), on the other hand, can be liquid in one pair but illiquid everywhere else—especially on unregulated or fringe venues.
Importantly, a large cap is not a guarantee of liquidity for every pair on every platform. For example, a blue-chip token paired with an obscure altcoin (e.g., ETH/SHIBA on a minor exchange) could have negligible depth and a yawning spread, regardless of its market cap elsewhere. Always check pair-specific data—market cap should complement, not replace, order book and volume checks.
Market Cap Tiers
| Tier | Typical Liquidity Profile | Examples |
| Large-cap | Deep, multi-exchange | BTC, ETH, BNB, XRP, SOL |
| Mid-cap | Moderate, selective depth | MATIC, AVAX, LDO, RNDR, STX |
| Micro/nano-cap | Often illiquid, high risk | Most new tokens, meme coins, etc. |
Market cap lends credibility, but only real liquidity, locked, on-exchange, and accessible, protects you as a trader. Next, let’s check the DeFi world’s closest equivalent, Total Value Locked (TVL).
TVL for DEX Pairs
Total Value Locked (TVL) refers to the total value of all assets pooled into a decentralized exchange’s liquidity pool for a given pair. In the absence of centralized order books, TVL becomes a primary metric for DeFi trade reliability.
Check out our top picks for DEXs.
A high TVL signals that plenty of assets are available to absorb trades. For major pairs, >$500K TVL is a common minimum for easy entries and exits. Below $100K TVL, even relatively small trades can cause wild price swings, and the risk of “rug pulls” (complete TVL withdrawals) spikes sharply.
How To Check TVL
- Use platforms like DEXTools, DEX Screener, or DeFiLlama.
- Look specifically at TVL for the pair you want to trade (sometimes, a protocol’s total TVL can be misleading).
Red Flags
- Pools with unlocked liquidity (liquidity can be withdrawn at any time).
- TVL below $50K for anything but the smallest orders.
- Sudden drops in TVL are often a precursor to rugs or exploit events.
While TVL is a DeFi-specific liquidity cousin, centralized listing dynamics also matter. For instance, a token with more listings is less likely to be bottlenecked by a single exchange’s order book or susceptible to manipulation.
Listings & Fragmentation
A crypto pair traded on many high-quality exchanges enjoys both visibility and redundancy. More reputable listings mean more venues, more market makers, and higher organic trading flow.
Fragmentation Warning
However, “fragmented liquidity” can dilute depth, and many listings with little volume may not help. Instead, prioritize tokens that have significant volume concentrated on regulated, reputable platforms. Single-exchange coins or those limited to little-known venues are at risk: one large order, or a liquidity pull by a single market-maker, can paralyze trading across the board.
Practical Tip
- Before entering a position, scan CoinMarketCap or CoinGecko for a full list of trading pairs and their respective 24h volumes and spreads.
- Favor pairs with at least three reputable exchanges and meaningful volume across more than one.
While listings and depth hint at the market’s health, the composition and quality of order flow also matter. This is where the “human” side of liquidity analysis comes into play.
Number/Quality of Market Makers
Order book health is a product of both “organic” and market maker (MM)-driven liquidity. Healthy markets exhibit two-sided depth, balanced increases in volume, and variability in order flow, rather than robotic, one-sided prints or a single MM controlling the book.
What to Watch For
- Repeated, identical-sized orders signal a single MM “painting the tape.”
- Massive single walls (buy or sell) at a round number.
- No-move volume (orders appear, but price stays static), suggesting non-genuine trading.
How to Investigate
- Compare trade histories for regularity.
- Watch for order book imbalances and real-time response to market news or external volume spikes.
- Review social channels for community feedback around MM activity or withdrawal incidents.
Layering these filters atop the five must-have indicators gives you a multidimensional view of crypto liquidity—and keeps you well ahead of the average participant, even on fast-moving platforms. Next, let’s move into practical, hands-on tool walkthroughs, helping you apply all this knowledge live, before every trade.
Tool How-Tos (Step-by-Step)
A strong understanding of liquidity indicators is only as valuable as a trader’s ability to assess them in real time. This section provides you with actionable, platform-specific walkthroughs so that you can vet any crypto pair before you execute—significantly reducing the risk of falling prey to low-liquidity pitfalls.
CoinMarketCap — Liquidity & Volume
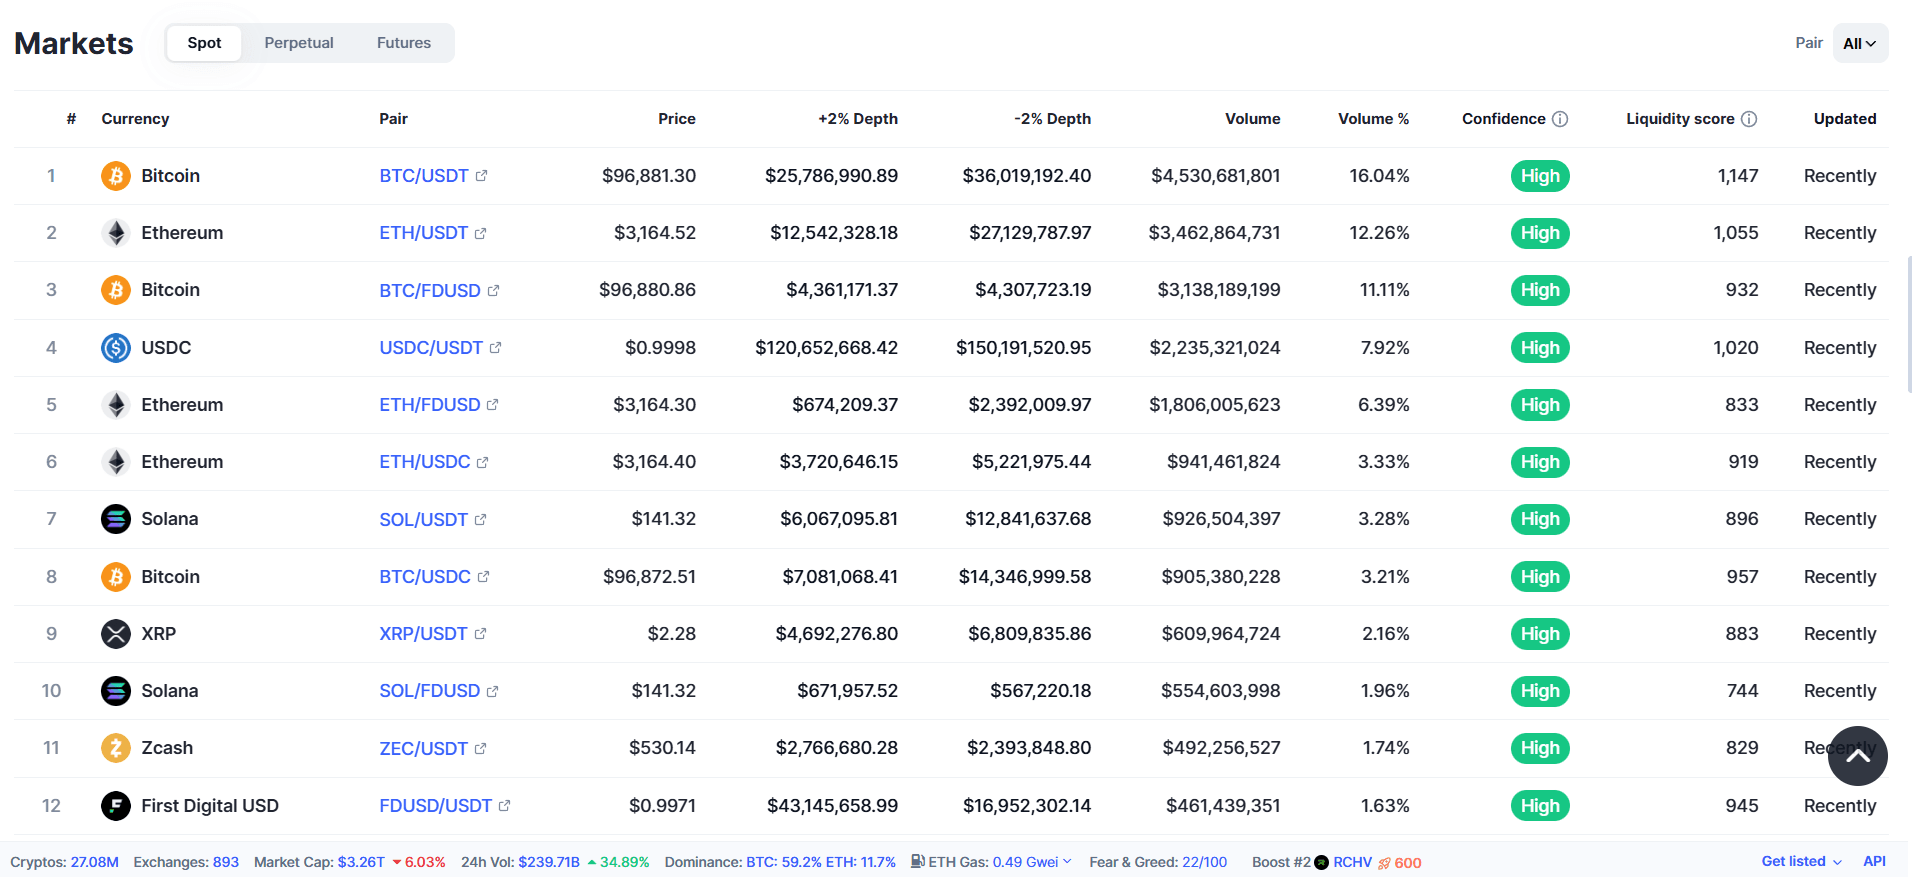 Key Data Points For Fast Liquidity Evaluation. Image via CoinMarketCap
Step 1: Token Search
Start by navigating to CoinMarketCap, the premier aggregator for token analytics and liquidity data. In the search bar, type in your asset of interest (e.g., “Solana” or “SHIB”).
Step 2: Markets Tab
On the token’s summary page, select the Markets tab. This provides a sortable table displaying every available trading pair across all exchanges—centralized and decentralized alike.
Step 3: Evaluate Key Columns
- Liquidity Score: Sort by this metric; it’s CMC’s proprietary blend of order book tightness, spread, and simulated order execution. Higher scores (>750) are safest.
- 24h Volume: Cross-check that your intended trade size is small relative to this value—ideally less than 1%.
- Spread: The lower, the better. Tight spreads signal rapid, reliable trade execution. Ignore venues with consistently >1% spreads.
- Pair & Exchange: Aim for Tier 1 venues (Binance, Coinbase, Kraken, KuCoin, OKX). Stay wary of obscure exchanges: sometimes, artificially high volume or liquidity can be spoofed.
Step 4: Red/Green Flags
- Red flag: Obvious outliers, one exchange claims 10x the volume/liquidity of all others combined, with a much wider spread. This often hints at manufactured volume or market making.
- Green flag: Good liquidity, tight spreads, and healthy volume distributed across multiple reputable exchanges.
For those trading the newest tokens or involved in the DeFi ecosystem, centralized rankings often aren’t enough. Next up: DEX liquidity assessment.
DEXTools / DEX Screener — DEX Liquidity
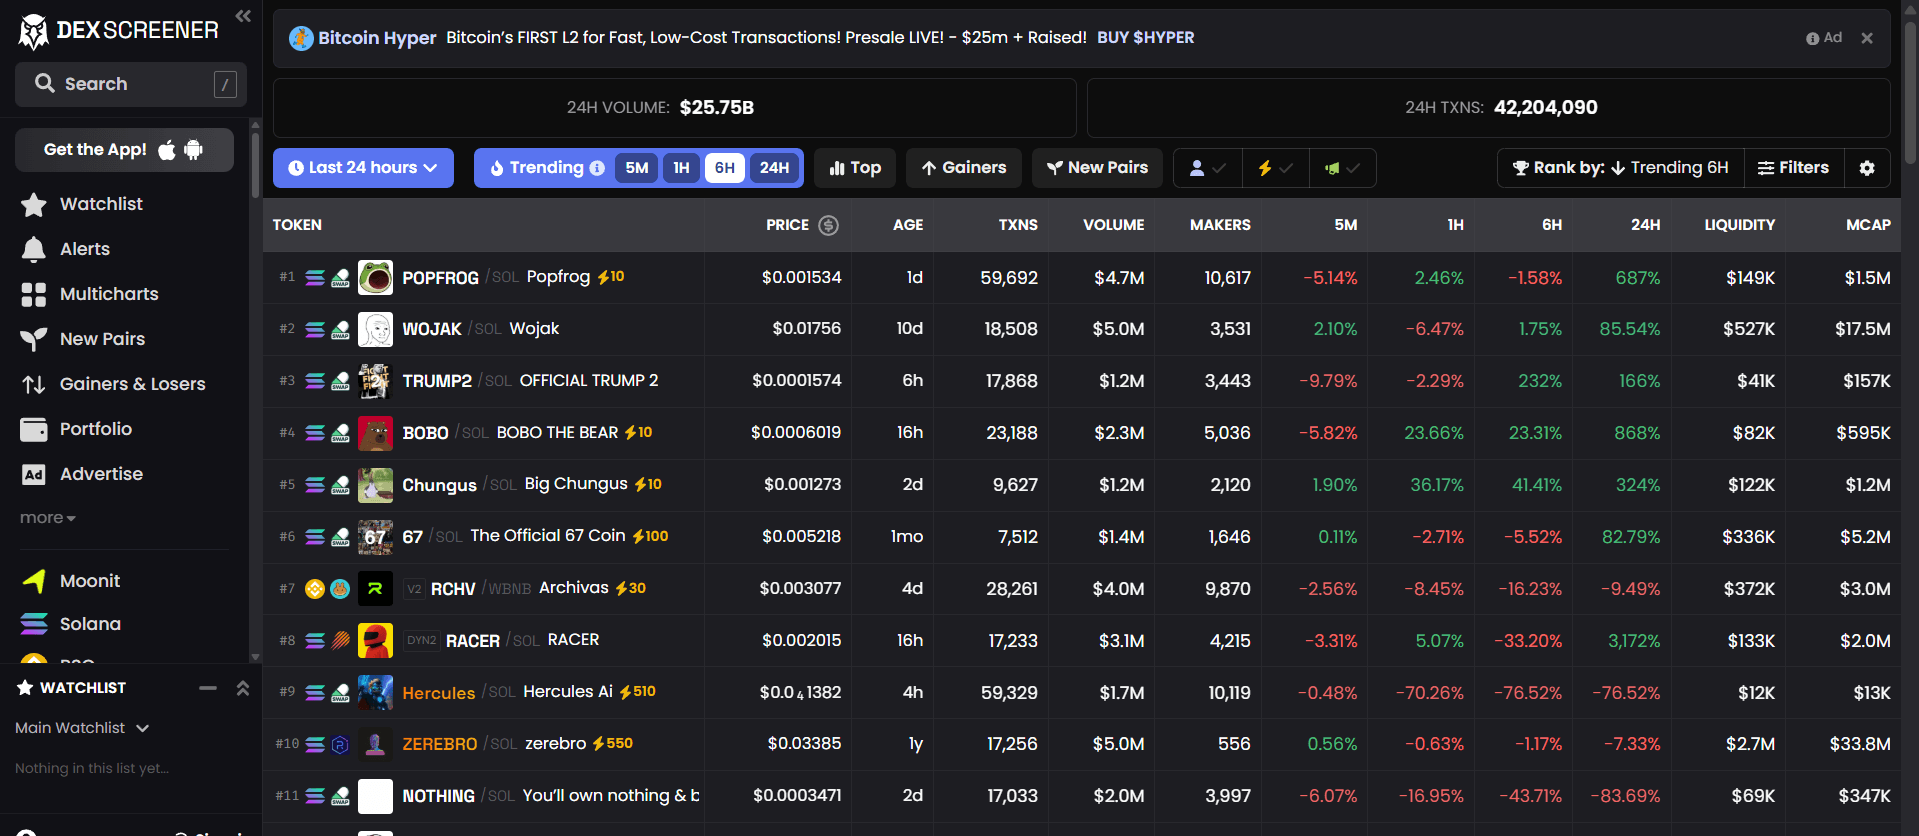 Key Data Points For Fast Liquidity Evaluation. Image via DEX SCREENER
Step 1: Locating Your Pair
Visit DEXTools.io or DEX Screener. Paste the contract address of your target token; the only guaranteed way to avoid “honeypot” or fake pools.
Step 2: Analyze Key Stats
TVL (Total Value Locked): Look for >$500K for risk-free trades, and >$100K as an absolute minimum.
24h Volume: Similar to CEX, but note that DeFi volume can be more volatile and cyclical.
Number of Transactions: A healthy pair sees steady buys and sells. A one-sided pool or days with <20 transactions signal risk.
Step 3: Special DEX Red Flags
Unlocked/Removable Liquidity: If the liquidity provider controls access, they can “rug pull” at any moment—always prefer locked pools.
Pool Dominated by a Single Wallet: If one participant holds >50% of liquidity, the pool can vanish, slippage spikes, or the token can be manipulated on a whim.
Recent TVL Drops: Sudden massive outflows often precede scams or exploits.
Step 4: Next-Gen Visuals
Both sites typically offer visualizations such as depth charts, recent trade lists, and historical liquidity flows. Thus, making it easy to spot sudden anomalies or new risks at a glance.
Whether CEX or DEX, the “hardcore” liquidity check is the order book. Here’s how to read it like a pro, catching hidden traps before you commit to a trade.
Exchange Order Book (e.g., Binance, Kraken, KuCoin)
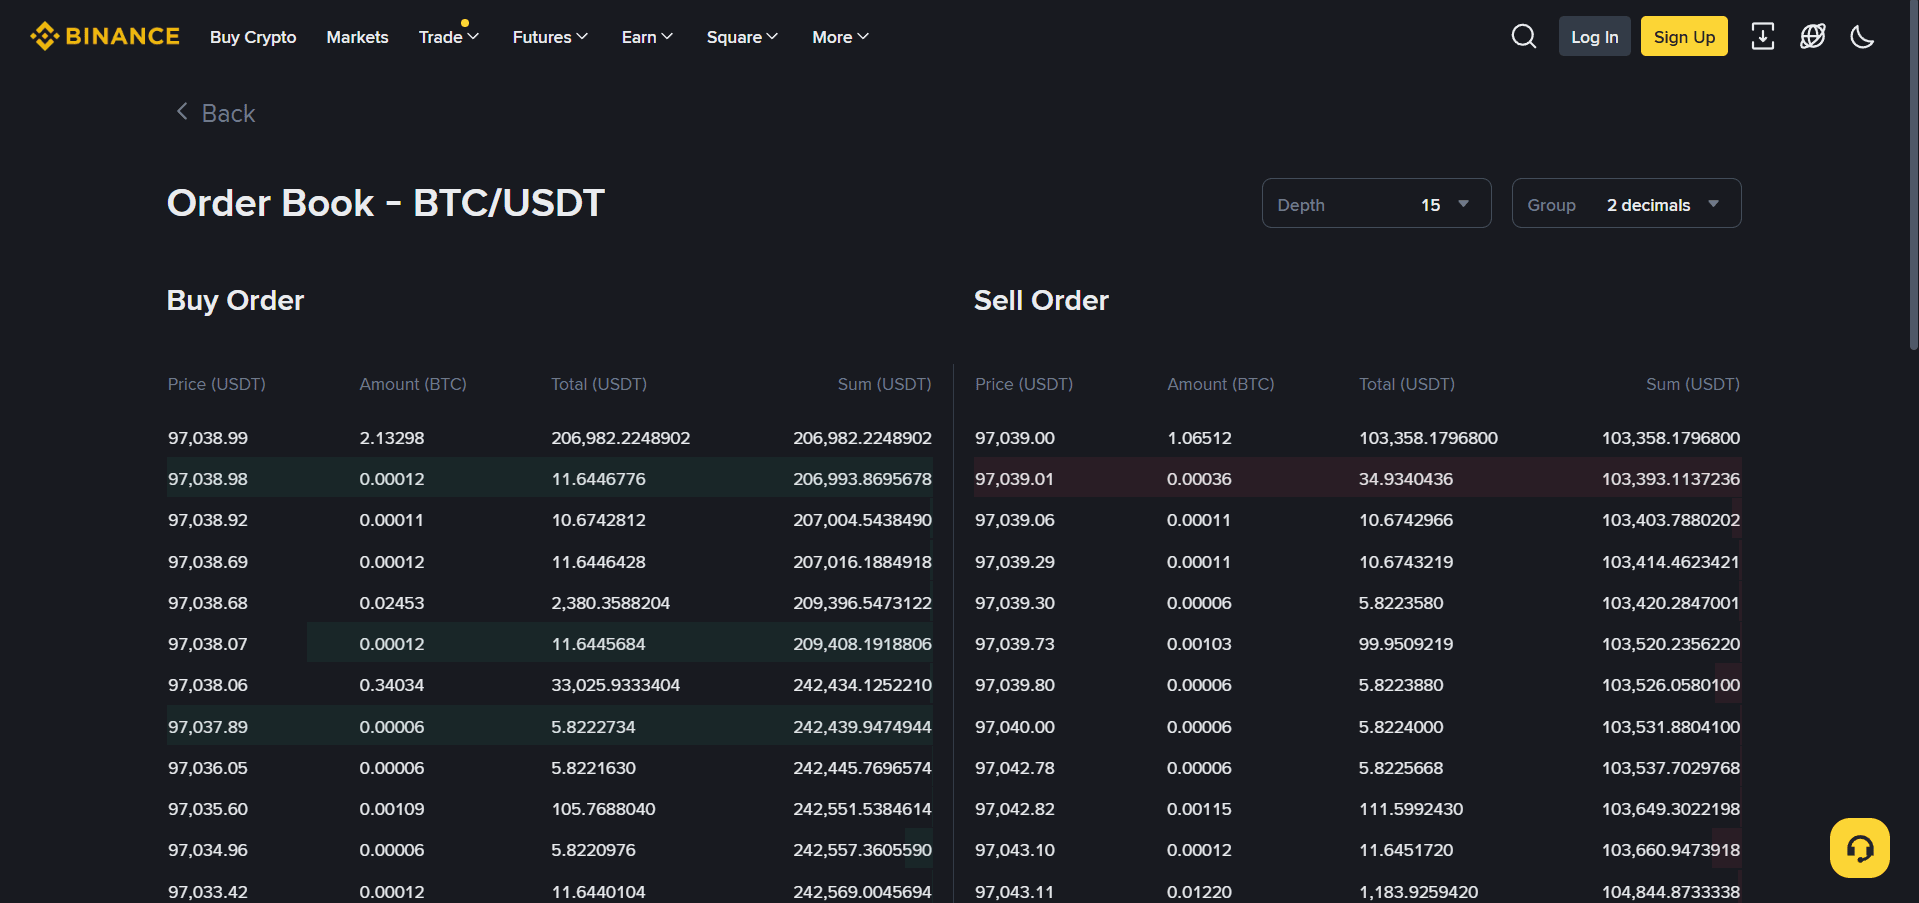 Exchange Order Book (e.g., Binance, Kraken, KuCoin). Image via Binance
Step 1: Open the Order Book and Depth Chart
Within any centralized exchange, click your token pair to view its order book. This panel displays every active buy (bid) and sell (ask) order at various price points.
Step 2: Assess Depth and Symmetry
Cumulative Orders: Add up the value of bids and asks within ±2% (and again within ±5%) of the current price. Look for at least $100K per side on altcoins, millions on blue-chips.
Symmetry: Strongly imbalanced Book, say, 95% of order size on the buy or sell side only—can break down rapidly.
Step 3: Spotting Red Flags
Gaps and Walls: Large spans with zero orders (“gaps”) signal the potential for price crashes. Walls (a single, massive chunk at a given price) may be used to trap or bait traders.
Artificial “Painting”: If most orders are perfectly round, same-sized, or move in lockstep with your order, you may be facing bot-driven market making.
Step 4: Volume and Trade Tape
Always watch the live trade print or tape: are trades happening at the bid, ask, or all over the board? Good markets have active prints, not stagnant trade flows.
Having mastered the practical checks, you are now ready to blend these with visual cues and advanced checklists—making your liquidity screening fast, evidence-based, and repeatable for every trade.
Practical Application: 9-Step Pre-Trade Liquidity Checklist
 A Structured Checklist For Smarter Pre-Trade Decisions. Image via Shutterstock
At this point, you understand the five core indicators, supplementary filters, and the tools to measure them. But theory without execution is worthless. This section provides the exact, step-by-step checklist you should run before every single trade, turning abstract knowledge into a disciplined habit and dramatically reducing your exposure to low-liquidity disasters.
The Complete 9-Step Workflow
1) Verify 24-Hour Trading Volume: Navigate to CoinMarketCap or your exchange and note the 24h volume for your target pair. The safe threshold is $1M; the hard floor for tiny trades is $100K.
2) Check Bid-Ask Spread: Confirm the spread is <0.5%. A red flag is >1%.
3) Validate CMC Liquidity Score: The score should be >750, ideal; >500 is the minimum.
4) Examine Order Book Depth: Visually inspect the order book and depth chart for dense levels within the ±2% window of the current price, with no large gaps.
5) Calculate Volume/MC Ratio: The daily volume should be >5% of the token's market cap; <1% is a major warning.
6) Count Reputable Listings: The pair should be listed on at least 3+ reputable, Tier-1 exchanges.
7) (DEX Only) Verify TVL: If trading on a DEX, confirm >$500K TVL and check that the liquidity is locked.
8) Execute Probe Order: Test a small order ($100–$500) to measure the actual slippage.
9) Apply Decision Matrix:
- All green: proceed with confidence.
- One red flag: Use a small size only.
- Two or more red flags: avoid the pair entirely.
Here's another pro-tip: Always backtest your crypto trading strategies to get better results and optimise your strategies
Strategy Adjustments by Liquidity Regime
 Trading Adjustments Based On Liquidity Conditions. Image via Shutterstock
Different liquidity environments call for different playbooks. Once you know whether a pair is deep or thin, the way you size positions, place orders, and manage risk shifts completely. The sections that follow break down how to adapt your strategy to each regime without overexposing yourself.
High-Liquidity Playbook
High-liquidity crypto pairs, such as BTC/USD or ETH/USD, are characterized by high trading volumes, tight bid-ask spreads, and deep order books. This environment is suitable for executing large trades quickly with minimal slippage and using a variety of strategies.
Rely on indicators that perform well with high data volume, such as:
- Volume Profile: To identify significant support and resistance levels.
- Moving Averages (MAs) and Moving Average Convergence Divergence (MACD): For trend confirmation and momentum.
- On-Balance Volume (OBV): To track buying and selling pressure and confirm price trends.
Strategy:
- Day Trading/Scalping: Execute multiple short-term trades to capitalize on small price movements.
- Trend Following: Use moving averages and other trend indicators to ride major market trends with larger position sizes.
- Liquidity Sweeps: Employ strategies that anticipate market reversals after a "liquidity sweep" or stop hunt of retail traders, entering trades after the price breaks a key level and reverses.
Low-Liquidity Playbook
Low-liquidity crypto pairs have thin order books and are susceptible to high volatility and significant slippage. Strategies in this regime must prioritize capital preservation and managing execution risk.
Focus on indicators that assess volatility and market momentum, acknowledging that signals may be less reliable.
- Bid-Ask Spread: A wide spread is a primary indicator of low liquidity.
- Order Book Depth: A thin order book indicates limited buy and sell orders, a hallmark of low liquidity.
- Average True Range (ATR): A rising ATR indicates increased volatility, a common trait of low-liquidity markets.
Strategy:
- Use Limit Orders: Avoid market orders to prevent high slippage and ensure execution at the desired price.
- Break Up Large Orders: To minimize price impact, split large orders into smaller ones and execute them incrementally over time.
- Position Sizing: Use smaller position sizes to reduce exposure to the high volatility and potential for significant losses.
- Arbitrage (Carefully): Exploit price differences across different exchanges, though this requires fast execution and awareness of high trading costs.
When to Walk Away
Knowing when to exit a trade or avoid a pair is crucial, particularly in volatile crypto markets.
- Significant Volatility and Slippage: If a pair's volatility is too high or slippage costs are consistently eating into potential profits, it may be time to step back.
- Shrinking Community or Failed Development: If the community supporting a project shrinks or the development team fails to deliver, it signals a long-term risk. Exit the position and move on.
- Fundamental Doubts: If you no longer believe in the long-term viability of the project underpinning the crypto asset, it's a clear sign to sell.
- Market Manipulation: Low-liquidity pairs are highly vulnerable to manipulation. If you observe repeated "pump and dump" schemes or erratic, unpredictable price movements, it's a signal to walk away.
- Profit Taking: If your investment has doubled or tripled, consider taking partial or full profits to secure gains and manage risk.
Bonus for your discipline: 5 On-Chain Signals Smart Crypto Traders Never Ignore
Case Studies
 Real Trades Proving Why Liquidity Always Matters. Image via Shutterstock
Here’s where the numbers stop being theory and start becoming reality. These examples show how liquidity behaves in the wild and how it shapes real trades across different market conditions.
BTC/USDT (High Liquidity)
Bitcoin (BTC) paired against Tether (USDT) is the benchmark for high liquidity in the crypto market. With daily trading volumes consistently exceeding $10 billion across major exchanges, this pair exhibits classic high-liquidity characteristics.
Key Metrics:
- Average Daily Volume: >$10 Billion USD
- Average Bid-Ask Spread: Typically less than 0.01%
- Order Book Depth: Large orders (>$1 million) can be filled with minimal slippage (<0.05%)
Case in Point:
March 2024 Bitcoin Drop: During a sharp market correction in March 2024, the BTC/USDT pair saw a $5,000 price drop within 1 hour. Despite the high volatility, sufficient liquidity ensured orderly markets; traders were able to execute large stop losses and new entry orders with predictable execution prices. The ability to absorb immense selling pressure without a market collapse highlights the pair's deep liquidity.
Takeaway: High liquidity provides market stability and predictable trade execution, even during extreme market stress.
Mid-Cap Alt (Moderate)
Consider a mid-capitalization altcoin like Solana (SOL) paired with USDT. These pairs offer decent volume but have thinner order books than top-tier assets.
Key Metrics:
- Average Daily Volume: $500 Million - $1 Billion USD
- Average Bid-Ask Spread: 0.05% - 0.1%
- Order Book Depth: Orders >$100,000 can cause noticeable slippage (>0.1%)
Case in Point:
February 2023 Network Outage: During a brief Solana network outage in February 2023, trading volume spiked as uncertainty grew. The market makers pulled liquidity, causing the bid-ask spread to widen significantly (up to 1-2% temporarily). A trader attempting to market-sell $200,000 worth of SOL at that moment experienced a slippage of approximately 0.8%—significantly higher than typical conditions—demonstrating how quickly moderate liquidity can dry up under stress.
Takeaway: Mid-cap pairs require careful execution, especially during news events. Liquidity can be fragile, and slippage is a real consideration for larger position sizes.
Micro-Cap (Low)
A micro-cap project with minimal recognition trades on decentralized exchanges (DEXs) or small centralized exchanges. Trading volume is low, and the market is highly susceptible to significant price movements.
Key Metrics:
- Average Daily Volume: <$50,000 USD
- Average Bid-Ask Spread: Can range from 2% to 10%+
- Order Book Depth: A single $1,000 market buy can move the price by 5% or more
Takeaway: Low-liquidity micro-caps are highly speculative environments where market orders can cause extreme price impact and capital can become trapped.
Risks & Red Flags
 Common Warning Signs That Expose Liquidity Problems. Image via Shutterstock
Trading low-liquidity crypto pairs involves significant risks that demand vigilance. The primary red flags are often linked to a lack of market depth, which can be exploited by manipulators and lead to adverse trading conditions.
Market Structure & Execution Risks
- Wide Bid-Ask Spreads: A spread consistently greater than 0.1% is a key indicator of low liquidity. In micro-caps, spreads can easily reach 2% to 10%+, signaling high transaction costs and difficulty in exiting a position at a fair price.
- High Slippage: Experiencing slippage of over 0.5% on a trade that is a standard size for your portfolio indicates insufficient liquidity. A 2% slippage means your trade was executed at a price 2% higher or lower than intended, an unacceptable cost for most traders.
- Low Average Daily Volume: A 24-hour trading volume of less than $100,000 USD (or a very low volume to market cap ratio) suggests extremely low liquidity and high vulnerability to price swings and manipulation.
- Sudden Illiquidity: Market depth charts showing massive "gaps" between buy and sell orders, where a relatively small market order (e.g., $1,000 USD in a micro-cap) can move the price by 5% or more, indicate a high risk of being unable to exit during stress.
Don't worry, we've got you. Mitigate your trading risks with these proven crypto strategies!
Manipulation Red Flags
- Unusual Trading Volumes/Spikes: A volume spike that reaches 60% or more of the highest volume observed over the last 30 days, especially without any fundamental news, can indicate a "pump" is in progress.
- Rapid, Unexplained Price Increases: Sudden price jumps of 20% or more within a very short timeframe (e.g., minutes or an hour) often point to artificial inflation of the asset's value.
- Social Media Hype with Specific Numbers: Be wary of accounts promising "10x returns" or specific, urgent profit numbers across platforms like Telegram or Discord; this often precedes a dump.
Project-Specific Warning Signs
- Centralized Control: A small number of wallets (e.g., top 10 holders owning >50% of the circulating supply) indicates high centralization risk, as these few entities can heavily influence the price or governance.
- Unsustainable Yields/Rewards: Projects advertising fixed APYs (Annual Percentage Yields) of over 100% in volatile token rewards are likely relying on continuous inflation, which can devalue the token quickly.
- Lack of Audits: The absence of a completed smart contract security audit from a reputable third party (e.g., CertiK or Hacken) for any significant project with locked value should be a major red flag.
- Poor Token Distribution: An extremely high max supply in the billions, or a supply that is heavily weighted towards the development team with short lock-up periods, suggests potential for massive dilution.
Wrapping It Up
Liquidity is the difference between seeing profits and keeping them.
When spreads stay tight, books run deep, and volume supports your position size, execution becomes predictable and risk stays manageable. The moment liquidity thins out, every decision becomes expensive, slippage spikes, exits get messy, and “paper gains” vanish on contact. So treat liquidity like a hard filter and you’ll avoid the traps that drain most traders long before price direction ever does.


