$1 FLOKI is unattainable under the current float. With a circulating supply near 9.3-9.7 trillion, even $0.01 implies a market value around $93-$97 billion. A realistic band for the next cycle sits closer to $0.00003-$0.00010, driven by meme risk cycles, venue depth, and any net burn progress. Treat FLOKI as a tactical trade, size small, take profits on strength, and watch supply and liquidity data before holding through drawdowns.
Quick forecast:
- 2026 range: Min $0.00006, Base $0.00012, Max $0.00100.
- 2030 base case: $0.000085.
- $1 math: At ~9.3-9.7T tokens, $1 implies about $9.3-$9.7 trillion market cap — that ~2.2× the whole crypto market today, ~3.8× Bitcoin, and ~18× Ethereum.
- Risk label: High risk, momentum driven, tightly linked to wider meme cycles and exchange liquidity.
What could change:
- Supply cuts: Large, verifiable burns or a redenomination that shrinks effective float.
- Utility with fees: Products that create steady fees, then buy and burn on a schedule.
- Liquidity breadth: More tier-1 listings, deeper books, tighter spreads across majors.
- On-ramps: Better fiat access, regional partners, simple retail flows into FLOKI pairs.
- Stronger cycle: A broad risk-on market that lifts meme assets for multiple quarters.
What to watch:
- Circulating supply: Official updates, chain totals, changes versus prior month.
- Burn pace: Monthly net burns as a percent of float, consistency over time.
- Order-book depth: 1 to 2 percent depth, top venues, spread stability during volatility.
- Volume mix: Share on tier-1 CEX, on-chain versus off-chain flow, wash-trade screens.
- Derivatives risk: Funding, open interest, liquidations that can drive spot swings.
- Large holders: Exchange inflows, whale wallets, unusual transfers.
- Policy news: Listing standards, ads rules, regional access changes.
Snapshot date: Feb. 2, 2026. Figures use price × circulating supply and the supply band cited in the FLOKI sections below. Check live data before any trade.

FLOKI at a Glance (Live Price Snapshot)
Figures auto-update via CoinGecko; always verify on your chosen exchange before trading.
The price is down 31.0% vs the 30-day close of $0.00010000, and it's down 28.7% vs the 90-day close of $0.00009685. The market cap of $669 million is down 29.9% vs 30-day's $954 million and down 27.6% vs 90-day's $924 million.
What Is Floki (FLOKI)?
Floki (ticker: FLOKI) began as a Shiba Inu–themed meme coin but has since expanded into a broader ecosystem that spans a metaverse game, DeFi tools, educational content, and branded commerce, all centered on utilizing and promoting the FLOKI token. The project describes this evolution on its official website and in its whitepaper, where it also explains that FLOKI operates across multiple blockchains.
 FLOKI is one of the Larger Meme-Coin Assets by Market Capitalization. Image via FLOKI
Origins & Community
FLOKI’s origin traces to the 2021 meme-coin wave and a viral cultural hook: Elon Musk’s announcement that “my Shiba Inu will be named Floki” on X (Twitter). The team and “Floki Vikings” community subsequently pursued aggressive brand-building and utility rollouts, highlighted again on the project’s official site and whitepaper. Key liquidity milestones included listings on Binance (Innovation Zone, May 5, 2023) and Binance.US (April 25, 2023), which expanded access and trading depth.
Current Positioning
Today, FLOKI is one of the larger meme-coin assets by market capitalization, generally grouped with Dogecoin and Shiba Inu on category trackers such as CoinGecko’s Meme Coins. Live market snapshots from reputable venues (e.g., Binance price page and CoinMarketCap’s FLOKI page) show that a significant share of spot liquidity concentrates on top centralized exchanges, with the FLOKI/USDT market on Binance typically among the highest-volume pairs.
The Mathematical Reality: Why $1 Is Out of Reach Today
A coin’s price target must be weighed against how many units exist. FLOKI’s supply sits in the multi-trillion range today, so even modest price goals translate into enormous market values.
 Even the Low Estimate Implies a Valuation on par with the World’s Largest Public Companies. Image via Freepik
Market Cap Calculation
FLOKI exists on both Ethereum and BNB Chain with an aggregate circulating supply in the ~9.3–9.7 trillion range. The project’s official FAQ breaks this down by chain and totals ~9.265 trillion as of June 16, 2025, while reputable trackers show live readings close to the mid-9-trillion band (see global market trackers referenced below for day-to-day variation).
Price target: $1
Required market cap: circulating supply × price
Using the band above:
• Low end: 9.265T × $1 ≈ $9.27 trillion
• High end: 9.7T × $1 ≈ $9.70 trillion
Even the low estimate implies a valuation on par with the world’s largest public companies, which is why “$1” is not a practical objective under today’s float.
Context Comparison
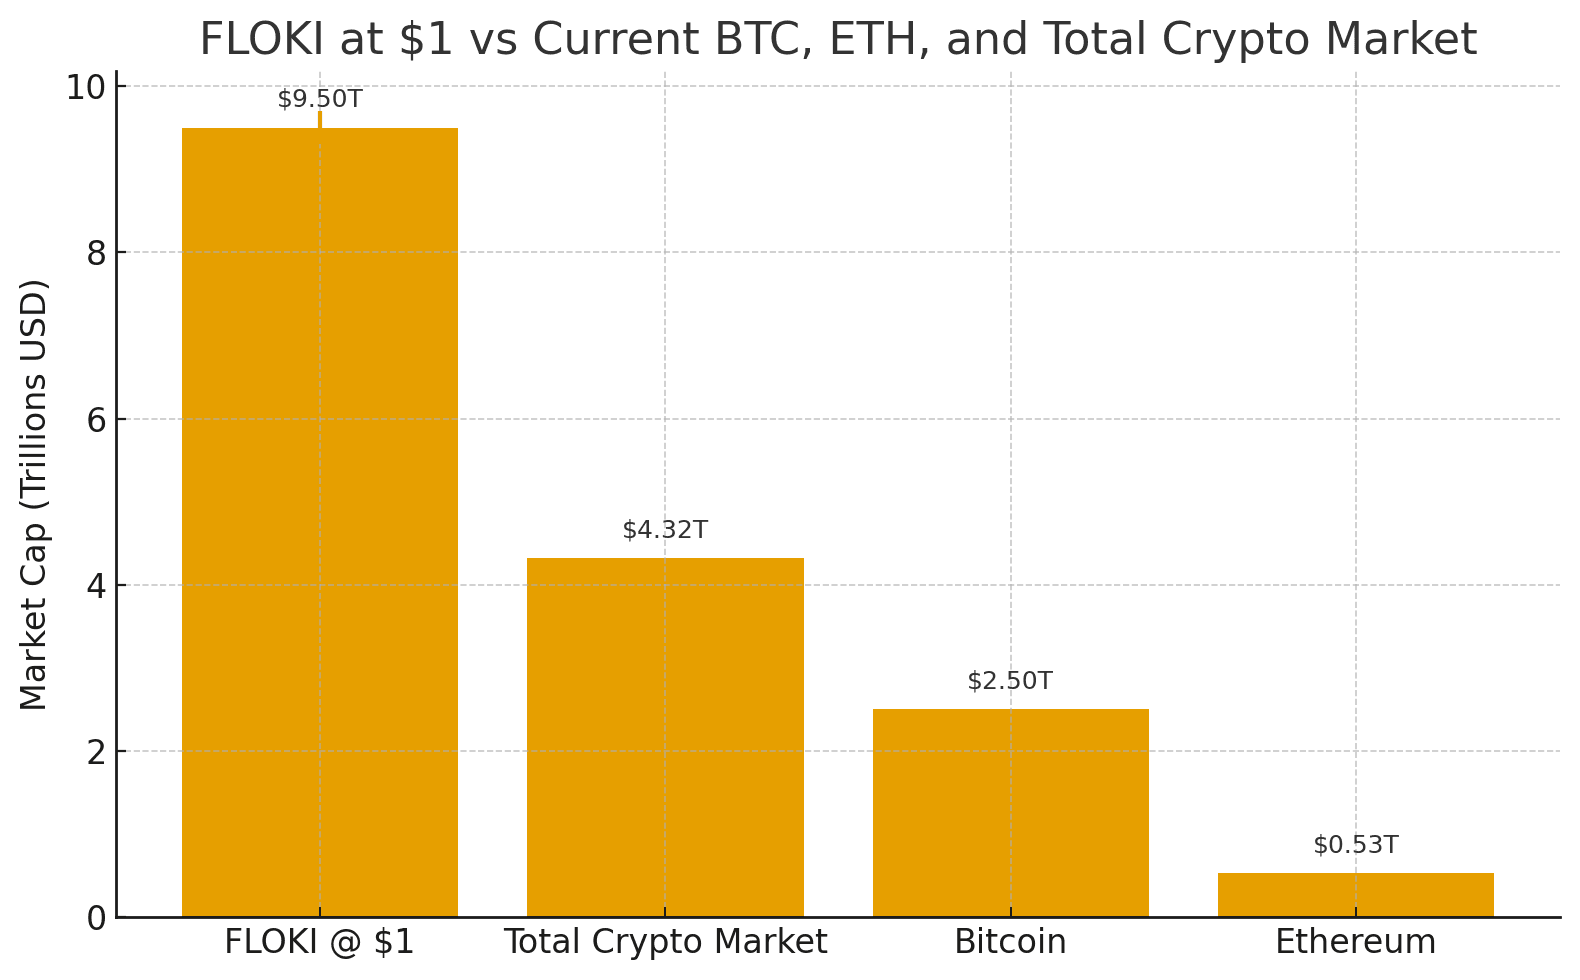 Putting FLOKI's $1 Dream Into Perspective
Today’s entire crypto market is about $4.23 trillion (global market cap). Bitcoin’s market cap is roughly $2.42 trillion (BTC market cap), and Ethereum’s market cap is about $524 billion (ETH market cap).
Put simply: a $1 FLOKI would require $9.3–$9.7 trillion, which is ~2.2× the whole crypto market today, ~3.8× Bitcoin, and ~18× Ethereum. Unless supply is drastically reduced or the entire market grows several-fold beyond current levels, the $1 target remains mathematically out of reach under present conditions.
Tokenomics, Supply & Burns
Tokenomics describes how a token’s supply is created, reduced, and distributed over time. For FLOKI, two fundamentals drive the story: it is issued on both Ethereum and BNB Chain, and supply reduction relies on ecosystem-driven buybacks and burns rather than a hard-coded, automatic burn.
 FLOKI Launched as a Multichain Asset with a 20T Total Supply Split Between Ethereum and BNB Chain. Image via FLOKI
Supply Structure
FLOKI launched as a multichain asset with a 20T total supply split between Ethereum and BNB Chain; the current chain-by-chain breakdown is published in the project’s FLOKI supply section. As last detailed there, Ethereum shows 10T total, 4.288T burned, 0.678T out of circulation, and ~5.034T circulating; BNB Chain shows 10T total, 5.769T burned, and ~4.231T circulating, for ~20T total, ~10.057T burned, and ~9.265T circulating in aggregate. For live snapshots that may fluctuate day to day, see the official site.
Burn & Fee Mechanics
FLOKI does not include a contract-level auto-burn. Instead, its burn mechanism routes a portion of ecosystem fees to buy back and burn tokens, specifically, 25% of service fees on ETH/BNB from Floki’s platforms and 1% of prepaid card top-up fees. Separately, operations are funded by a 0.3% buy/sell tax on on-chain trades (no tax on transfers), which is distinct from the burn allocations described above.
Supply Dashboard
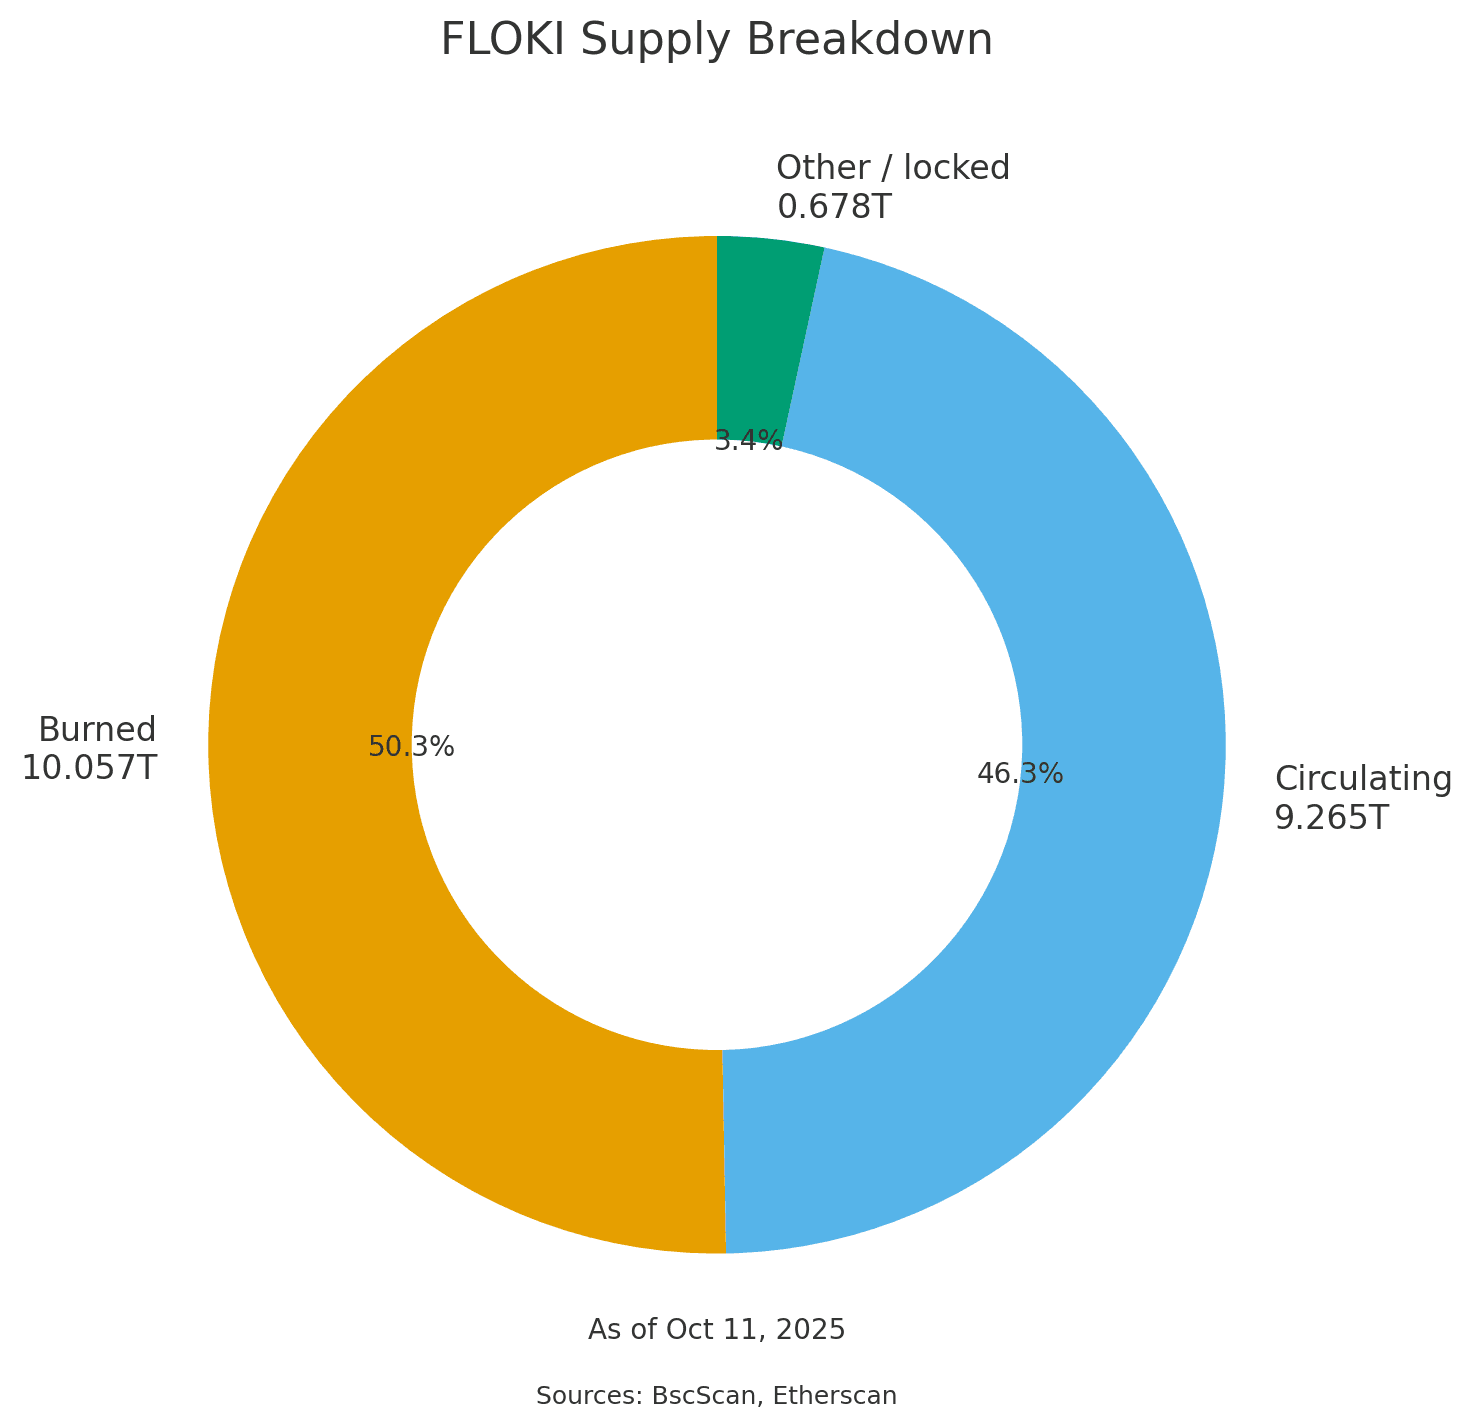 Total FLOKI vs Burned vs Circulating
FLOKI Ecosystem: Can Utility Bend the Ceiling?
Utility can’t rewrite the math on supply, but it can improve demand and shrink float via fees and burns. FLOKI’s ecosystem is designed around that idea: products generate activity and fees, and defined portions of those fees route to buybacks and burns, alongside other deflationary levers disclosed in the project materials.
 TokenFi Targets Token Launches and Real-World-Asset Tokenization. Image via FLOKI
Valhalla (Metaverse/Game)
Valhalla is FLOKI’s on-chain NFT metaverse game where players battle with “Veras,” craft items, and progress through play-to-earn mechanics, with the token serving as the in-game backbone (Valhalla overview; playable at valhalla.game). For adoption signals, track active players and marketplace activity via official channels (news posts, site stats), plus general community engagement. While Valhalla’s gameplay does not hard-code a burn, ecosystem fees elsewhere can still support FLOKI reductions.
FlokiFi (DeFi suite)
FlokiFi Locker and related tools are the project’s DeFi arm, focused on locking LP tokens, NFTs, and other assets (FlokiFi page). Per the project’s burn mechanism disclosure, 25% of Floki-owned platform service fees (ETH/BNB) automatically buy back and burn FLOKI, and 1% of prepaid debit card top-up fees also go to buy-and-burn actions.
In addition, the Floki Trading Bot charges a 1% trade fee, with 50% periodically used to buy and burn FLOKI (bot terms). These are policy-level parameters; readers should rely on the live docs for any changes.
TokenFi (RWA/launch tooling)
TokenFi targets token launches and real-world asset tokenization. The project’s FAQ notes that similar 25% fee buybacks apply to TokenFi products but are used to repurchase and burn TOKEN (TokenFi’s token), not FLOKI (burn FAQ). Any impact on FLOKI is therefore indirect (brand, user funnel, or treasury decisions), not a direct burn pipeline.
Mini scorecard
| Potential Demand Drivers | Current Traction | Data to Watch |
|---|---|---|
| Valhalla gameplay loop & retention | Public test/playable build live | Active players, in-game transactions, marketplace activity |
| FlokiFi Locker usage & referrals | Multi-chain support and locks | Protocol fees, number/size of locks, burn transactions |
| Trading Bot convenience | Live bot with periodic buybacks | Bot trade volume, burned amounts per period |
| TokenFi tokenization funnel | Live platform (TOKEN-centric) | Product volumes, any cross-ecosystem effects on FLOKI |
Historical Performance & Cycles
FLOKI’s price history broadly tracks crypto risk cycles: it tends to surge when liquidity chases higher-beta assets and cools when the market de-risks. As a meme-coin with a large float, moves can be outsized in both directions, often lining up with Bitcoin’s post-halving risk-on phases and spillovers from Dogecoin and Shiba Inu rotations.
Key Milestones
FLOKI launched in 2021 during the meme-coin wave. According to CoinGecko’s FLOKI page, the all-time high is $0.0003449 (June 5, 2024), while the all-time low is July 6, 2021, illustrating how volatile early trading was.
After the 2022 bear market, momentum rebuilt into and after Bitcoin’s fourth halving (April 19, 2024, block 840,000), an event confirmed on Blockchain.com’s block explorer and summarized by LSEG/FTSE Russell. Meme-peer flows matter too: DOGE’s ATH (May 8, 2021) and SHIB’s ATH (Oct 28, 2021) mark prior rotation peaks that often coincide with broader risk cycles.
Key Milestones Table
For raw daily prints and CSV export, see historical data.
| Date | Marker | FLOKI Price (if applicable) | Why it matters |
|---|---|---|---|
| 2021 (launch year) | Launch window | N/A | FLOKI entered markets during the meme-coin wave, alongside DOGE/SHIB rotations mentioned above. |
| July 6, 2021 | All-Time Low (ATL) | $0.00000002 | Establishes the cycle floor early in trading. |
| May 8, 2021 | DOGE cycle peak | N/A | DOGE hit its ATH, a proxy for meme-sector euphoria that set context for FLOKI’s early cycle. |
| Oct 28, 2021 | SHIB cycle peak | $0.0001991 | SHIB’s ATH marked the second major meme-rotation apex of 2021. |
| April 19, 2024 | Bitcoin halving | $0.0001389 | BTC’s fourth halving at block 840,000 preceded renewed risk-on flows into higher-beta assets. |
| June 5, 2024 | All-Time High (ATH) | $0.0003449 | Recorded ATH on CoinGecko above; anchors the top of the current cycle. |
| Jun 2024 – Oct 2025 | Post-ATH range | $0.00001991-$0.0002880 | Price action has largely ranged with broader liquidity; meme-sector rotations continue to influence momentum. |
Data checked: Oct. 11, 2025. Prices from CoinGecko and CoinMarketCap. The FLOKI token launched in June 2021.
Can FLOKI Reach $1? Scenarios
Price targets must be anchored to circulating supply and the basic math of market capitalization. Because FLOKI’s float is in the multi-trillion range, as we mentioned earlier, each cent of price implies tens of billions of dollars in value. That reality frames the scenarios below.
 The Prevailing view is that $1 is not Feasible under the Current Supply because Market Cap. Image via Freepik
Analyst/Publisher Consensus
Across data-driven outlets, the prevailing view is that $1 is not feasible under the current supply because market cap equals price × circulating supply. Applying that formula to FLOKI’s multi-trillion float yields a multi-trillion-dollar requirement for a $1 target, which is well beyond today’s market context. In short, math, not sentiment, sets the ceiling.
Optimistic Case (not $1)
In a strong bull market with deeper tier-1 order books, rising ecosystem usage, and an accelerated burn pace, a reasonable upside band is $0.001–$0.005. At ~9.3–9.7T circulating, that equates to roughly $9–$10B at $0.001 and $46–$48B at $0.005. Hitting the high end would likely require exceptional liquidity, broad exchange penetration, and consistently high fee generation to support buybacks and burns.
Bear Case
If meme-sector rotation fades, liquidity concentrates in a few venues, or listing/venue policies tighten, downside bands like $0.00005–$0.00015 are plausible stress scenarios. Those levels imply market caps of approximately $0.5–$1.5B on the same circulating-supply band. In such conditions, price tends to reflect thinner order books, higher slippage, and slower ecosystem throughput, amplifying volatility in both directions.
Realistic Milestones Instead of $1
Rather than fixating on $1, it’s more useful to anchor goals to circulating supply, as we mentioned before, and ask what market cap the ecosystem could realistically support in different liquidity regimes.
 A Move to $0.01 Implies Roughly $93–$97B in Market Value on the Same Supply Band. Image via Freepik
Path to $0.001 (1/10th cent)
At ~$0.001, FLOKI’s implied market cap would be roughly $9–$10B on a ~9.3–9.7T circulating band (price × supply). Hitting and sustaining this level would likely require a top-of-cycle backdrop (broad crypto risk-on), deeper tier-1 order books to absorb flow, and consistent ecosystem throughput that fuels fee-driven buybacks and burns.
Practically, that means higher daily spot volumes, healthy derivatives liquidity without excessive leverage, and visible user activity across the products outlined above.
Stretch to $0.01
A move to $0.01 implies roughly $93–$97B in market value on the same supply band, an order of magnitude jump. That would place FLOKI in the realm of large L1/L2 platforms by capitalization at various points in the cycle; readers can gauge current peers on CoinGecko’s market-cap rankings.
Reaching this tier would almost certainly require extraordinary utility (material, recurring demand for the token), significantly accelerated net burns or other credible float-reduction programs, and broad global distribution (fiat on-ramps and major exchange coverage).
Without those structural shifts, and absent a much larger overall crypto market, $0.01 should be treated as an upper-bound stretch rather than a base-case target.
Yearly Price Tables
These are scenario ranges (not predictions or advice). We use the circulating-supply band referenced above and the standard market-cap = price × supply formula (see “How we model” noted below) to keep numbers consistent with liquidity regimes and product adoption.
Table A — 2026–2030
| Year | Base min | Base max | Bull max | Bear min | Market cap @ Bull max | Note |
|---|---|---|---|---|---|---|
| 2026 | $0.00012 | $0.00040 | $0.00100 | $0.00006 | ~$9.3B–$9.7B | Broader exchange penetration, sustained ecosystem fees, orderly derivatives participation. |
| 2027 | $0.00015 | $0.00060 | $0.00150 | $0.00007 | ~$14.0B–$14.6B | Rising Valhalla/FlokiFi usage; periodic buybacks visible on-chain. |
| 2028 | $0.00020 | $0.00080 | $0.00200 | $0.00008 | ~$18.6B–$19.4B | Higher on-ramp availability; improved order-book depth across top venues. |
| 2029 | $0.00025 | $0.00100 | $0.00300 | $0.00010 | ~$27.9B–$29.1B | Strong cycle plus ecosystem throughput; faster net burns versus issuance/leakage. |
| 2030 | $0.00030 | $0.00120 | $0.00400 | $0.00012 | ~$37.2B–$38.8B | Stretch environment short of $0.01; needs exceptional liquidity and adoption. |
Table B — 2031–2035
| Year | Base min | Base max | Bull max | Bear min | Market cap @ Bull max | Note |
|---|---|---|---|---|---|---|
| 2031 | $0.00035 | $0.00140 | $0.00450 | $0.00015 | ~$41.9B–$43.7B | Late-cycle follow-through; activity across products sustains fee flows. |
| 2032 | $0.00040 | $0.00160 | $0.00500 | $0.00018 | ~$46.5B–$48.5B | Upper bound aligns with our optimistic case ceiling. |
| 2033 | $0.00040 | $0.00160 | $0.00500 | $0.00018 | ~$46.5B–$48.5B | Similar dynamics; upside capped by float unless materially reduced. |
| 2034 | $0.00040 | $0.00160 | $0.00500 | $0.00018 | ~$46.5B–$48.5B | Requires persistent demand and multi-year exchange depth improvements. |
| 2035 | $0.00040 | $0.00160 | $0.00500 | $0.00018 | ~$46.5B–$48.5B | Long-range stretch; assumes strong crypto market and ongoing burns. |
Note: We picked the numbers from CoinCodex and Changelly, and tied price bands to likely liquidity regimes (risk-on vs risk-off) and adoption proxies (usage of Valhalla/FlokiFi/Trading Bot and on-ramp breadth). Implied caps use the circulating-supply band. Data current as of Feb. 2, 2026.
Market Structure: Volume, Liquidity, Listings
Liquidity is the bridge between interest and executable price. Deep order books absorb larger buys/sells with less impact; shallow books magnify slippage and volatility. For FLOKI, most spot activity concentrates on major centralized venues, with aggregation sites showing multi-exchange distribution.
 Depth Matters because your Order must Match Available Bids/Asks at each Price Level. Image via Freepik
Trading Depth & Slippage
Depth matters because your order must match available bids/asks at each price level. If you market buy more than what’s sitting at the top of the book, your order “walks the book,” paying higher prices for each slice. To reduce slippage:
- Prefer stable-quote pairs (e.g., FLOKI/USDT or FLOKI/FDUSD) on top venues where depth is typically strongest (check the venue’s pair page for live 1%/2% depth).
- Use limit orders for large tickets; if speed matters, split into smaller tranches over time (“TWAP”-style) instead of one sweep.
- Trade during peak liquidity windows for the venue’s user base (often U.S. or EU business hours on global exchanges).
- Avoid executing immediately after volatile news or during maintenance windows.
Disclaimer: Slippage is dynamic and varies by venue, time, volatility, and your order size relative to recent volume. Always check the live order book on the specific exchange before placing size.
Exchange Coverage
Live volumes/depth are visible on each exchange page; tiers/fees vary by account status and region.
| Exchange | Pair | 24h volume | Depth note | Fee tier |
|---|---|---|---|---|
| OKX | FLOKI/USDT | See OKX pair page for latest | Typically deep main book; derivatives available | Standard maker/taker, VIP tiers |
| Bybit | FLOKI/USDT | See Bybit spot page for latest | Active retail flow; check top-of-book size | Tiered fees with discounts |
| KuCoin | FLOKI/USDT | See KuCoin market for latest | Good alt liquidity hours; regional skew | Tiered maker/taker |
| Gate.io | FLOKI/USDT | See Gate.io market for latest | Depth varies with sessions | Tiered fees; point rebates |
| Binance | FLOKI/FDUSD | See Binance market for latest | Deep stable-quote pair; strong retail flow | VIP ladder; promos rotate |
Note: Availability of fiat on-ramps and specific quote currencies differs by jurisdiction; check each venue’s buy/sell portals and regional terms for current coverage.
Competitors & Capital Rotation
FLOKI competes within the meme-coin category, where attention, liquidity, and exchange coverage drive outcomes as much as fundamentals. For beginners, think of this segment like trending apps on a store; placement and buzz can shift quickly, pulling capital from one name to another.
 FLOKI Competes within the Meme-Coin Category where Attention, Liquidity, and Exchange Coverage Drive Outcomes as much as Fundamentals. Image via Freepik
Meme-Coin Peers (DOGE, SHIB, FLOKI)
Qualitative comparison (evergreen); use linked profiles for live figures.
| Project | Supply | Market cap | Listings count | 30D spot volume | Social reach (proxy) | Notes |
|---|---|---|---|---|---|---|
| Dogecoin (DOGE) | Uncapped issuance via fixed block rewards (Dogecoin docs) | Large-cap cohort (see CoinGecko profile) | Widespread tier-1/2 coverage | Very high in risk-on phases | Large community on X | Oldest meme coin; deepest liquidity among peers. |
| Shiba Inu (SHIB) | Large initial supply with ongoing burns (Shiba Inu portal) | Large-cap cohort (see CoinGecko profile) | Broad tier-1/2 coverage | High, often rotation-driven | Strong presence on X | Ecosystem includes Shibarium and branded utilities. |
| Floki (FLOKI) | Multichain supply; project discloses totals and burns (FLOKI FAQ) | Mid-/large-cap cohort (see CoinGecko profile) | Broad, including major venues | High in risk-on; varies by venue | Active “Vikings” on X | Fee-driven buyback/burn design |
Rotation Patterns
Flows tend to rotate across DOGE → SHIB → smaller memes (including FLOKI) during risk-on phases, then consolidate back into BTC/ETH when volatility rises. In practice, that means FLOKI outperformance is most durable when category-wide attention and exchange depth rise together; when attention narrows or liquidity thins, leaders (often DOGE/SHIB) typically recapture share. Beginners can think of this like music charts; hits lift the whole genre, but the top acts usually absorb most streams once the surge cools.
Risks & Headwinds
Meme coins are high-beta assets: liquidity thins fast, big holders matter, and policy shifts can move access and demand. Treat FLOKI like a small boat in busy waters, so plan entries, size modestly, and monitor conditions.
| Risk | Why it matters | Signal to watch | Mitigation |
|---|---|---|---|
| Volatility spikes | Rapid swings can cause poor fills/forced exits. | Daily ranges; IV/RV on trackers; news bursts | Prefer limit orders; scale entries; avoid chasing during news. |
| Whale concentration | Large holders can move price/liquidity. | Top holders on Etherscan / BscScan; big exchange inflows. | Size small; stagger orders; watch wallets before sizing up. |
| Leverage blow-ups | Liquidations cascade through thin books. | Funding/OI spikes; liquidation prints; see liquidation guide. | Avoid/limit leverage; prefer spot for longer horizons. |
| Ad/listing policy scrutiny | Affects reach, on-ramps, liquidity. | Standards like Coinbase listings; Google Ads crypto policy. | Maintain multi-venue access; monitor policy updates. |
| Rug/meme fatigue | Sector trust shocks drain attention/volume. | Category volume/attention slumps; rotations into BTC/ETH. | Conservative sizing; take profits into strength; keep cash buffer. |
Should You Buy FLOKI Now?
Disclaimer: This is not financial advice.
FLOKI appeals to investors who value community-driven projects and a busy ecosystem roadmap (game, DeFi tools, utilities) that channels recurring fee-based burns referenced earlier. Those strengths can support demand in risk-on markets.
On the other hand, FLOKI has a massive circulating float, which makes the $1 target mathematically unrealistic under the current supply. It’s also exposed to rotation risk within the meme sector and venue dependence (liquidity concentrated on a handful of exchanges).
Practical tips for beginners: start with small position sizes; use limit orders to control entry; watch spreads and execute during peak-liquidity hours; diversify venue risk (don’t rely on a single exchange); avoid leverage, liquidations can cascade in thin books; and for long holds, consider cold storage after confirming network and token contract details with the project’s official disclosures mentioned above.

Long-Term Potential: What to Track Quarterly
Long-run outcomes hinge on steady utility and liquidity, not one-off hype. A simple quarterly checklist helps keep expectations grounded and decisions consistent with the supply and burn mechanics noted earlier.
KPIs to monitor (beginner-friendly guide):
- Monthly burn rate (% of circulating supply): Compare each month’s net burns to the prior quarter to see if the pace is accelerating (see the burn mechanism referenced above).
- Valhalla DAU/MAU: Active players and returning users indicate whether the game loop is sticky (see Valhalla overview mentioned earlier).
- Ecosystem fee run-rate: Track whether fees from Floki-owned products (e.g., Locker, Trading Bot, prepaid card) are growing quarter over quarter, since fee growth fuels buybacks/burns.
- Top-venue depth & spreads: Check live order-book 1–2% depth and quoted spreads on your primary exchange’s pair page (the order-book primer linked earlier explains why this matters).
- New on-ramps/partners: Look for additions such as new fiat gateways, regional exchanges, or commerce tie-ins announced via the project’s official channels.
- Share vs DOGE/SHIB: On category trackers referenced earlier, compare FLOKI’s market cap and 30D volume to peers to gauge whether it is gaining or losing share during risk-on phases.
Parting Tip: Log these items in a small spreadsheet and review every quarter to avoid reacting to day-to-day noise.