$1 PEPE is mathematically impossible under its 420.69 trillion token supply. Even $0.01 would imply a $4.2 trillion market cap, which is larger than the entire crypto market today. A more realistic path is to treat PEPE as a high-risk momentum asset whose upside depends on meme rotation, liquidity depth, and broader crypto sentiment, not on fundamentals or cash-flow generation.
Quick forecast:
- 2026 outlook: Soft to mixed, with CoinCodex projecting a mostly subdued year and a year-end range closer to $0.0000031–$0.0000039.
- Cycle-high zone: The stronger recovery window in the current model appears in Q1 2027, with a projected high near $0.0000096.
- 2030 model ceiling: CoinCodex’s current long-range max sits near $0.0001483, which would imply a market cap of roughly $62.4 billion.
- $1 math: 420.69 T × $1 = $420.69 trillion market cap, far beyond any realistic meme-coin outcome.
- Risk label: Extreme risk, sentiment-driven, and highly sensitive to whale flows, exchange liquidity, and social momentum.
What could change:
- Broader access: New exchange products or ETF-related developments could expand visibility and trading access.
- Liquidity expansion: Sustained order-book depth across major CEXs and DEX pools would make higher valuations easier to support.
- Utility creation: PEPE would need real recurring demand, such as payments, gaming, or fee-linked ecosystem use, to justify materially higher long-term ceilings.
- Cleaner holder structure: A less concentrated supply base would improve market resilience during volatility.
- Meme-sector revival: A broad return of speculative appetite across meme coins could lift PEPE even without major fundamental change.
What to watch:
- Liquidity depth: Real 1–2% depth across major venues, not just headline daily volume.
- Holder distribution: Whether whale concentration improves or remains a structural risk.
- Volume quality: How much trading comes from top-tier spot markets versus short-term speculative bursts.
- Market sentiment: Meme rotation, search demand, and social dominance spikes.
- Macro context: Bitcoin trend, broader crypto risk appetite, and whether capital is rotating back into high-beta assets.
- Access catalysts: Any real progress on PEPE-linked investment products or listings that expand reach.
Snapshot date: April 13, 2026. Figures reflect CoinGecko supply data and CoinCodex forecast data available at the time of writing. Always verify live price, supply, and market cap before trading.

Editor's Note (April 13, 2026): We updated this article in April 2026 to reflect PEPE’s latest price, market cap, and supply data, while replacing older cycle assumptions with CoinCodex’s current 2026–2030 forecast model. Compared with the previous version, this refresh lowers the near-term outlook, shifts the projected cycle-high window from 2026 into Q1 2027, updates the market-cap math behind key price targets, refreshes the current-phase analysis for April 2026 conditions and removes older assumptions that no longer fit PEPE’s current market structure.
The Mathematical Reality: Why $1 Is Impossible For PEPE
Pepe’s supply is fixed at 420 trillion tokens, a number that mathematically blocks any path to a $1 valuation. At a current price of about $0.00000347, PEPE’s market capitalization sits near $1.46 billion. For PEPE to rise from there to $1, its market cap would need to expand to roughly $420 trillion, a figure that dwarfs not only the entire crypto market, but even the global equity market.
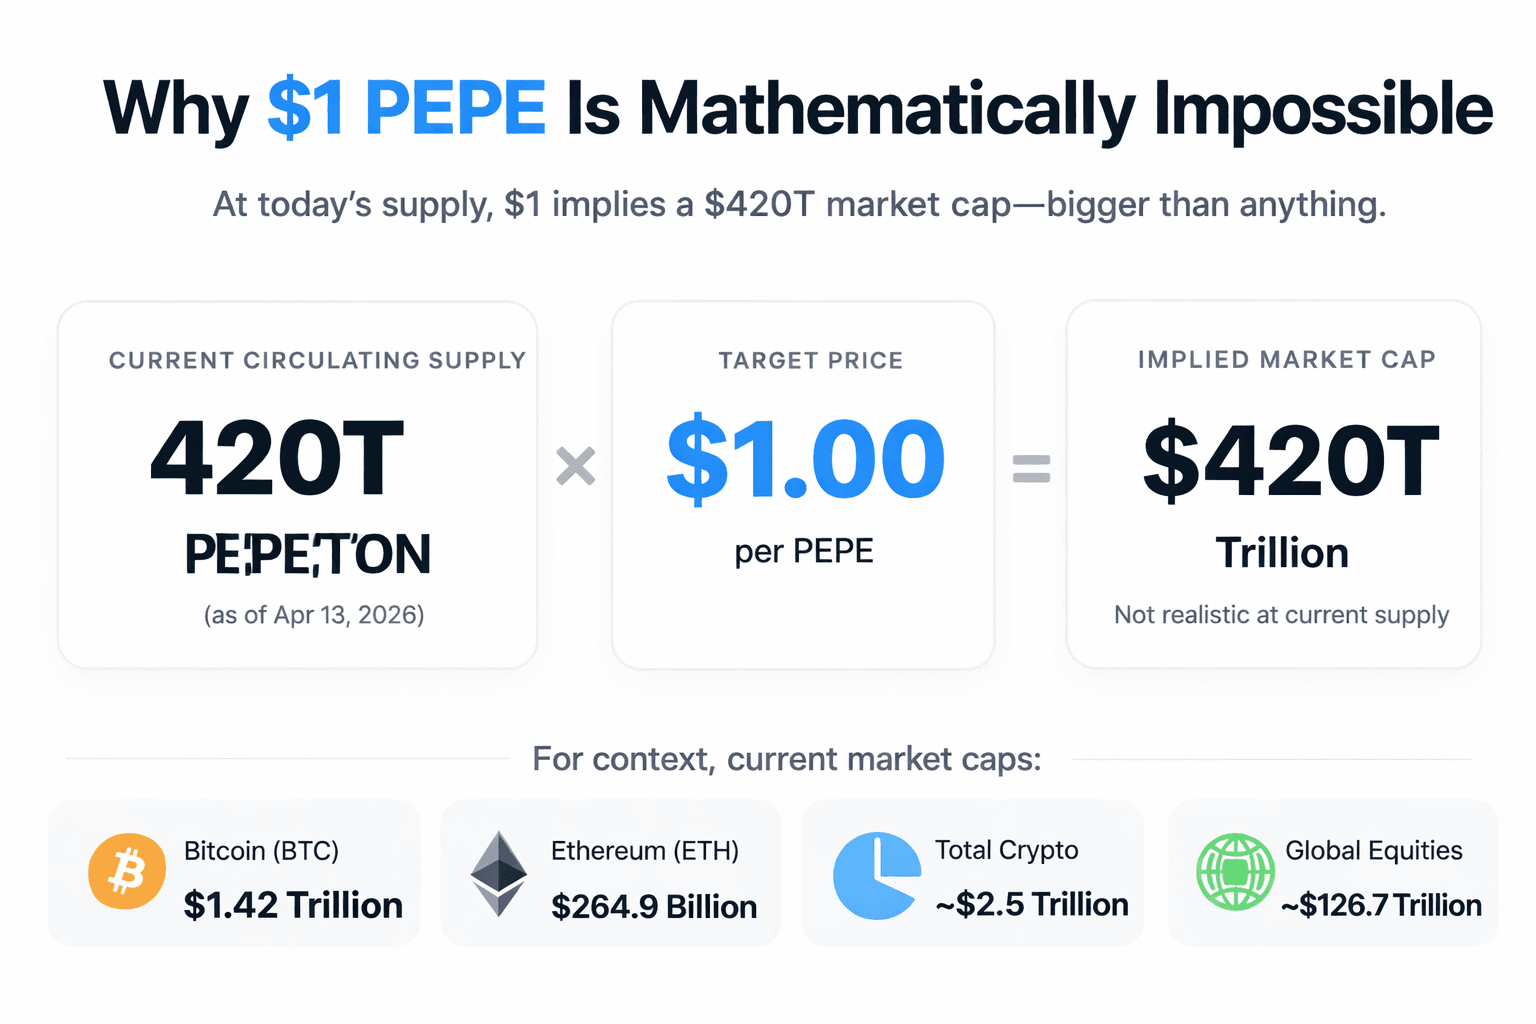
Let’s break that down through supply and market cap math.
Note: Data as of April 13, 2026
Supply vs Market Cap
The relationship is simple:
Price × Circulating Supply = Market Cap
That equation is the core reason why the “PEPE to $1” thesis collapses under scrutiny. With roughly 420 trillion PEPE in circulation, the math looks like this:
$1 × 420 trillion = $420 trillion market cap
That would make PEPE worth far more than any crypto asset in history. For context, the entire crypto market currently sits around $2.49 trillion, with Bitcoin alone at about $1.42 trillion. Even the global equity market, at roughly $126.7 trillion, is still nowhere near the level PEPE would need to justify a $1 price.
Even if speculative capital flooded back into meme coins, the gap is still absurdly large. The problem is not marketing, listings, or social momentum. The problem is the supply base itself.
Realistic Ceilings
Let’s break down more plausible price targets:
- $0.0001 per PEPE would imply a market cap of roughly $42 billion
- $0.001 per PEPE would imply a market cap of roughly $420 billion
- $0.01 per PEPE would imply a market cap of roughly $4.2 trillion
- $1 per PEPE would imply a market cap of roughly $420 trillion
A move to $0.0001 would already require PEPE to become one of the largest crypto assets in the market. A move to $0.001 would demand a valuation comparable to the very biggest networks in crypto history. At $0.01, PEPE would need to be worth more than the entire crypto market is worth today. And at $1, the number leaves crypto and enters fantasy.
What Is Pepe Coin?
 Pepe Coin Is Viral Cryptocurrency Built On Humor And Massive Online Community
Pepe Coin is an ERC-20 token on the Ethereum blockchain, launched on April 17, 2023. It was designed as a tribute to the long-running “Pepe the Frog” meme culture. The project had no presale, no VC funding, and no roadmap at launch, making it a purely community-driven experiment that quickly became a major meme-asset with measurable liquidity and exchange coverage.
Origins and Background
PEPE’s viral rise began on decentralized exchanges, then spread to major centralized listings. Its narrative relied on cultural recognition rather than utility. Within weeks of launch, the token reached hundreds of millions in market cap as social sentiment and retail speculation collided.
Its structure mirrors earlier meme coins such as Dogecoin (DOGE) and Shiba Inu (SHIB), but on a tighter supply model:
- Blockchain: Ethereum
- Token Standard: ERC-20
- Launch Date: April 17, 2023
- Initial Supply: 420,690,000,000,000 PEPE
- Presale/Team Allocation: None disclosed; community launched
- Primary Theme: Internet meme legacy + speculative trading
Like DOGE and SHIB, PEPE’s identity lies in community virality, not in fundamental economic design.
Pepe Ecosystem and Utility
The ecosystem remains light. PEPE functions primarily as a tradeable meme asset, not a productive protocol token. Its limited practical use cases include:
- Liquidity provisioning on DEXs such as Uniswap.
- Exchange listings on Binance, OKX, and Bybit are driving retail access.
- Community initiatives such as NFT collections and meme contests reinforce brand recall.
- Token burns (notably the 6.9 trillion burn in October 2023) serve sentiment rather than supply impact.
Developers have hinted at future integrations such as mini-games and NFT tie-ins, but these remain speculative. It is safe to say that PEPE has a social-market experiment showing how online culture can bootstrap a asset without any formal roadmap or intrinsic utility.
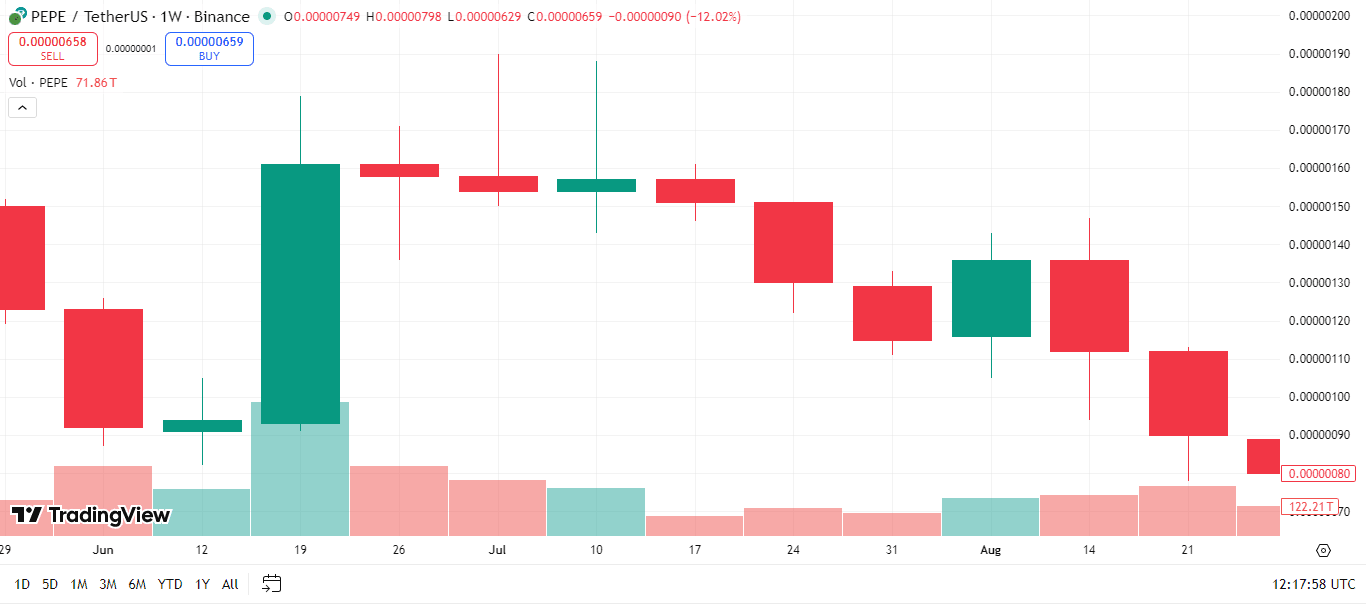
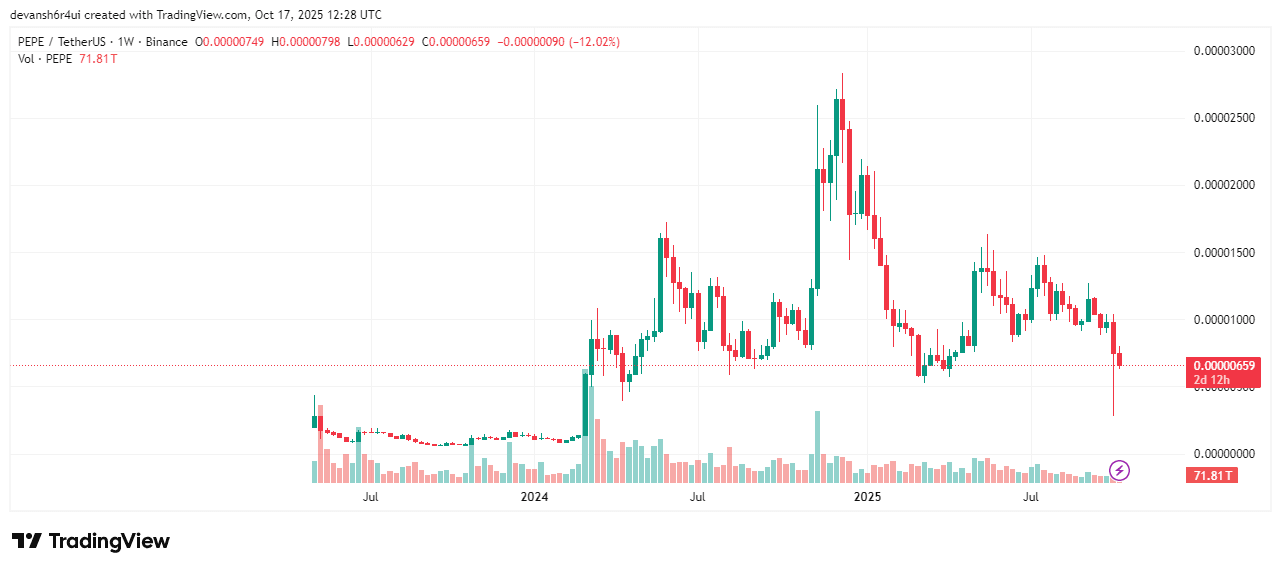
Historical Price Trends of PEPE
Pepe’s price history mirrors the macro market with inflation, brief consolidations, and reflexive recoveries tied to social sentiment rather than utility growth. Since its April 2023 launch, PEPE’s chart has shown four different phases of price trends: initial mania, correction and stabilization, burn-driven rally, and 2025 consolidation.
Launch and Early Surge (April–May 2023)
PEPE debuted at roughly $0.00000006036. Within three weeks, speculative flows from retail traders and meme communities sent it soaring by over 1,000x, breaching $0.0000072 in early May 2023. The surge followed Binance’s and OKX’s listings, which pushed volume above $1 billion per day at peak.
First Correction and Stabilization (June–August 2023)
 Pepe Faced Its First Market Correction In 2025. Image via TradingView
After the hype cooled, profit-taking caused a 70% retracement. The token found support around $0.0000018–$0.0000022, where it stabilized as daily volumes dropped below $200 million. This period also saw a gradual migration of liquidity to DEXs and smaller CEX pairs.
Token Burn and Rally (October 2023–June 2024)
 Pepe ATH in June 2024 At $0.00002825. Image via TradingView
On October 24, 2023, the project executed a 6.9 trillion PEPE burn, worth about $55 million at the time. This triggered a renewed wave of bullish sentiment, leading to a rally that peaked at an all-time high (ATH) of $0.00002825 in June 2024. The event proved that community-driven burns, though mathematically minor, could influence short-term demand and perception.
2026 Cycle and Current Phase
As of April 13, 2026, PEPE trades near $0.00000347 with a market capitalization of roughly $1.46 billion. That leaves the token well below its late-2024 all-time high zone, but still firmly inside the group of large-cap meme assets with meaningful exchange liquidity and daily turnover. Over the last 24 hours, PEPE has recorded roughly $259 million to $307 million in trading volume across major trackers, showing that speculative interest is still present even after the broader meme frenzy cooled from prior peaks.
The 2026 picture looks less like a euphoric breakout and more like a reset phase. PEPE is currently trading around 80% to 87% below its all-time high, depending on the reference point you use, which places it in the familiar post-hype pattern seen across meme coins after major expansion cycles. Rather than trending in a clean directional move, PEPE has spent much of early 2026 behaving like a high-beta sentiment asset, bouncing with shifts in meme-coin appetite, exchange flows, and broader crypto risk sentiment.
The technical indicators of Pepe as of April 13, 2026, show:
- Structure: Sideways consolidation in early April 2026 between $0.00000327–$0.00000347, with price compressing after a weaker March and still lacking a confirmed breakout trend.
- Momentum: Oscillators are neutral, which points to mixed short-term momentum rather than a strong bullish or bearish impulse. TradingView’s technicals page currently flags the oscillator summary as Neutral.
- Support levels: $0.00000327 acts as the recent local floor from the late-March to early-April range, while $0.00000347 marks the upper edge of that recent recovery band and serves as the first nearby resistance zone.
- Bias: Mixed to slightly cautious, with TradingView showing neutral oscillators but a broader sell trend on the higher-timeframe summary. In plain terms, PEPE remains range-bound and still looks like a coin waiting for a stronger macro or meme-rotation catalyst.
The historical pattern sticks to one truth, which is, PEPE’s price movements respond more to liquidity waves (and macro changes) and meme rotation cycles than to any internal utility evolution.
Market Capitalization & Supply Considerations
 Total Value Of All Pepe Tokens Circulating In Market Affects Its Price. Image via Shutterstock
Pepe’s valuation mechanics hinge entirely on its token supply and circulating market capitalization. With all 420.69 trillion tokens already in circulation, the market has no deflationary buffer, and every price change directly multiplies across the entire supply, magnifying the implied market cap beyond sustainable thresholds.
Current Market Cap vs. $1 Target
At roughly $0.0000035, Pepe’s market cap stands near $1.45 billion to $1.47 billion. That places it around the top 50 to mid-50s globally by market cap, still large enough to remain visible in the meme-coin tier, but far below the biggest crypto assets.
If the price reached $1, its market cap would explode to roughly $420 trillion, assuming the current tradable supply base of about 420 trillion PEPE. That would make it worth far more than Bitcoin and more than 3x the size of the global equity market, which SIFMA estimated at about $126.7 trillion.
Pepe’s market ceiling is still mathematically constrained by supply. Even modest-looking price jumps require enormous capital inflows, and once the target moves into $0.001, $0.01, or $1 territory, the valuation requirements quickly push beyond what crypto markets can realistically absorb.
Supply and Circulation Challenges
Unlike Bitcoin or Ethereum, PEPE lacks programmed scarcity. As of April 13, 2026, CoinGecko lists its circulating supply, total supply, and max supply all at 420.69 trillion tokens, which means there is no meaningful emission schedule, vesting curve, or lockup structure reducing the float over time.
More importantly, there is no recent, broadly verified burn event that materially changes this picture. While various 2025–2026 community posts and exchange-social content have discussed new burn plans or long-term burn roadmaps, those claims have not translated into a supply shift large enough to alter PEPE’s valuation math in a meaningful way. As things stand, the market is still pricing PEPE against a supply base of 420.69 trillion tokens.
To make a truly meaningful difference, the reduction would have to be extreme. A 99.9% supply reduction would still mean destroying roughly 420.27 trillion tokens, leaving only about 420.69 billion in circulation. That shows how large the supply base really is, and why occasional burn narratives do not come close to solving the valuation problem.
PEPE’s supply model keeps it locked inside a speculative valuation loop, where price rallies depend far more on trading momentum, meme rotation, and liquidity conditions than on tokenomics. The large supply makes the token easy to trade and easy to meme, but it also puts a hard ceiling on future upside unless PEPE sees either large-scale, verifiable token reduction or real utility that creates recurring demand.
Realistic Price Targets: What PEPE Can Achieve
 Realistic Price Targets Of Pepe. Image via Shutterstock
While the $1 target is mathematically impossible, PEPE can still post meaningful upside during favorable market cycles. But that upside depends far more on capital inflows, liquidity depth, and meme-sector rotation than on fundamentals or utility.
As of April 13, 2026, CoinCodex’s model paints a much more restrained near-term picture, with 2026 looking soft for most of the year before a stronger rebound scenario appears in early 2027.
Short-Term Outlook (Next 6–12 Months)
Based on CoinCodex projections, PEPE’s near-term trajectory looks more defensive than explosive. The model shows weakness through much of Q2 to Q4 2026, with only a modest recovery by year-end rather than the kind of mid-2026 breakout that older forecasts implied.
CoinCodex currently lists PEPE at about $0.000003468, with a 1-month prediction of $0.000002600, a bearish sentiment reading, Fear & Greed at 16, and 14-day RSI at 55.33, which together suggest a market still lacking strong speculative momentum.
Phase 1: Mild Correction and Sideways Accumulation (Oct 2025 – April 2026)
CoinCodex’s monthly table suggests PEPE could spend much of the middle of 2026 trading below current levels.
| Month | Projected Max Price |
|---|---|
| April 2026 | $0.000003475 |
| May 2026 | $0.000002817 |
| June 2026 | $0.000002795 |
| July 2026 | $0.000002650 |
| August 2026 | $0.000002639 |
| September 2026 | $0.000002845 |
| October 2026 | $0.000002852 |
This phase fits a weaker-risk-appetite setup, where PEPE remains liquid and tradeable but struggles to attract the kind of reflexive meme flows needed for a major expansion. In practical terms, CoinCodex’s model points to a market still digesting earlier excess rather than preparing for immediate price discovery.
- Support band: Roughly $0.0000024–$0.0000026
- Resistance: Roughly $0.0000028–$0.0000035
- Sentiment driver: Weak market mood and low risk appetite
Phase 2: Late-2026 Stabilization (November – December 2026)
By the end of 2026, the model becomes less negative. CoinCodex projects a firmer range for the final two months of the year, suggesting stabilization rather than a euphoric breakout.
| Month | Projected Min Price | Projected Max Price |
|---|---|---|
| November 2026 | $0.000002728 | $0.000003274 |
| December 2026 | $0.000003144 | $0.000003858 |
That is not a full recovery cycle, but it does imply PEPE could finish 2026 in better shape than it spends most of the year.
Cycle-High Scenario (2026–2027 Window)
The more optimistic part of CoinCodex’s current model appears in late 2026 through early 2027, not in mid-2026. The forecast suggests PEPE’s stronger recovery window arrives around December 2026 to March 2027, followed by a cooling phase rather than a second parabolic leg.
| Month | Min. Price | Avg. Price | Max. Price |
|---|---|---|---|
| Dec 2026 | $0.000003144 | $0.000003346 | $0.000003858 |
| Jan 2027 | $0.000004067 | $0.000006514 | $0.000009553 |
| Feb 2027 | $0.000005916 | $0.000007295 | $0.000009394 |
| Mar 2027 | $0.000006858 | $0.000007540 | $0.000008439 |
| Apr 2027 | $0.000006241 | $0.000007262 | $0.000007820 |
| May 2027 | $0.000005504 | $0.000006046 | $0.000006469 |
| Jun 2027 | $0.000004861 | $0.000005719 | $0.000006254 |
| Jul 2027 | $0.000004676 | $0.000005064 | $0.000005424 |
| Aug 2027 | $0.000004845 | $0.000005011 | $0.000005499 |
| Sep 2027 | $0.000005709 | $0.000006103 | $0.000006402 |
| Oct 2027 | $0.000005818 | $0.000006093 | $0.000006332 |
| Nov 2027 | $0.000005841 | $0.000006020 | $0.000006178 |
| Dec 2027 | $0.000005122 | $0.000005487 | $0.000005936 |
That puts the likely modelled cycle-high zone in Q1 2027, with the strongest monthly maximum at $0.000009553 in January 2027, before PEPE gradually cools into a more moderate range through the rest of 2027.
Stretch Case: Why $0.001 Is Difficult for PEPE
Reaching $0.001 per PEPE represents an extreme upper-bound outcome that borders on mathematical impossibility under current market mechanics.
At that level, with a circulating supply of 420.69 trillion tokens, PEPE’s market capitalization would rise to roughly $420.69 billion. That would place it far beyond today’s meme-coin tier and force it into the upper ranks of the crypto market, despite having no major yield engine, governance utility, or durable cash-flow mechanism.
Even in a strong bull market, that would require PEPE to absorb a very large share of total crypto liquidity. The issue is not whether PEPE can rally, but whether a meme token can credibly sustain a valuation measured in the hundreds of billions of dollars. PEPE’s current market cap is around $1.46 billion, so a move to $0.001 would imply an expansion of nearly 290x from current levels.
Such dominance would mean a meme coin with no intrinsic yield, governance role, or major DeFi utility surpassing the scale that most speculative meme assets have historically achieved.
For context:
- Dogecoin’s 2021 peak market cap reached about $85.3 billion, still far below what PEPE would need to touch $0.001.
- Shiba Inu’s 2021 peak market cap is widely cited in the $40 billion to $54 billion range, depending on the data source and date used, which again sits well below PEPE’s required $420.69 billion threshold.
In short, to justify a $0.001 valuation, PEPE would require:
- A paradigm shift in meme-asset perception, where meme coins are treated as durable value stores rather than cyclical speculation
- Massive global liquidity rotation into non-yielding meme assets
- Sustained speculative demand far beyond what current models and prior meme-coin cycles support
Without those structural changes, $0.001 remains a theoretical ceiling, not a credible base-case target.
Factors That Drive PEPE’s Price
 Social Media & Market Sentiment Hype Dominates Pepe Price Trends. Image via Shutterstock
Pepe’s price dynamics are defined less by fundamentals and more by behavioral liquidity loops, feedback cycles driven by retail sentiment, meme culture, and short-term trading flows. Each price movement ties back to the same structural variables: community engagement, the overall market liquidity, and exchange depth.
Community & Social Media Momentum
PEPE thrives on cultural energy. Mentions across X (formerly Twitter), Reddit, and Telegram correlate directly with intraday volatility.
- Social Dominance: Data from LunarCrush shows PEPE’s social mentions spiking during meme rotations, particularly during burn events or influencer tweets.
- Engagement Loops: Increased social chatter leads to retail inflows, raising price and in turn boosting online visibility. This reflexive cycle sustains short-term rallies but fades rapidly when attention shifts. The 2023 and mid-2024 rallies both began with viral Twitter trends that coincided with a surge in wallet activity and CEX volumes.
Sentiments of the community remain the single most consistent driver of PEPE’s volatility.
Broader Market Cycles
PEPE’s liquidity patterns loosely follow Bitcoin’s market cycles but with much higher volatility and short-lived trends. Analysis shows that when Bitcoin experiences significant rallies, as in early and mid-2025, PEPE can see amplified but temporary surges driven by speculative sentiment and meme hype rather than strictly macroeconomic factors. However, the statistical correlation between PEPE and Bitcoin remains weak, and PEPE’s price is far more susceptible to sharp corrections, often diverging from Bitcoin after initial rallies.
- Volatility and Momentum: PEPE often outperforms during short-lived Bitcoin bull phases but then suffers sharper and more frequent corrections, making its price trajectory highly unpredictable.
- Liquidity Compression: Bearish periods in the crypto market see huge PEPE volume declines, but available data shows instead, daily volumes fluctuate with broader market sentiment and speculative activity.
Trading Volume & Listings
Liquidity distribution dictates survivability.
- Exchange Coverage: PEPE is listed across all major centralized platforms: Binance, OKX, Bybit, Bitget, and KuCoin, and trades actively on Uniswap V3 and Curve.
- Volume Patterns: Average daily turnover exceeds $500 million, with about 70% of liquidity concentrated on Binance and OKX pairs.
- Spread Dynamics: The presence of perpetual futures markets amplifies both price discovery and volatility.
- Listing Effects: Historical spikes (e.g., Binance listing in May 2023, Coinbase tracking announcement in mid-2024) produced 30–80% short-term rallies as access expanded.
Sustained growth depends on maintaining high-quality liquidity, not just retail order flow. If tier-1 exchanges sustain deep order books, PEPE can remain structurally tradeable regardless of price stagnation.
Check out the best memecoin exchanges.
Risks & Challenges
 High Volatility, Low Utility, Manipulative Whales: Memecoin Fears. Image via Freepik
Despite its visibility and community scale, PEPE operates under structural and behavioral risks that limit its long-term stability. These risks are tied to market reflexivity, regulatory uncertainty, liquidity fragility, and lack of intrinsic value creation. Together, these factors make it a high-volatility asset class.
- Extreme price swings: The token is infamous for its volatility, with the price prone to dramatic spikes and equally sharp crashes. For instance, a recent downturn saw PEPE lose a significant portion of its value.
- Reflexive drawdowns: This risk is evident in PEPE's history, with analysts noting a recurring pattern of large-percentage drawdowns (historically averaging around 64%) after reaching new price highs. These corrections happen when momentum fades, leading to a self-reinforcing downward spiral as holders exit their positions.
- High market saturation: The meme coin market is crowded with many competitors, including established players like Dogecoin (DOGE) and Shiba Inu (SHIB). This makes it challenging for PEPE to maintain investor attention over the long term, especially without a distinct utility.
- Fading hype: For PEPE to have long-term success, its cultural relevance and community engagement must be sustained. This is a significant challenge, as internet trends and popular memes can be fleeting.
- "Whale" influence: Large holders of PEPE tokens, known as "whales," have the ability to significantly influence the market. Their buying or selling activity can cause sudden price movements that inexperienced retail investors may not anticipate, leading to losses.
- No intrinsic value: PEPE was created as an entertaining meme token with no inherent utility or intrinsic value, as its creators have openly stated. Its value is based entirely on market demand and social factors, not on technological innovation.
- Poor scalability: As an ERC-20 token built on the Ethereum L1 (Layer 1 protocol), PEPE transactions can be slower and more expensive due to network congestion, especially when compared to dedicated L2 solutions designed for scalability.
It is always more effective to prevent losses in the crypto market by proactively following risk management strategies than to react to them.
PEPE Long-Term Potential
 Is Pepe Anything Beyond the Meme? Image via Shutterstock
PEPE's long game depends on converting attention into repeatable on-chain activity. That requires new demand sinks, not more trading pairs.
What would need to change:
- Utility modules: payment plugins, tipping rails, loyalty points, mini-games that consume PEPE.
- Partner distribution: brand tie-ins that lock PEPE for perks or merch access.
- Creator economy hooks: revenue shares or ad credits funded in PEPE.
- Programmable burns: fee-based burns tied to usage rather than one-off events.
But even for this to be achieved few measurable signals must be watched:
- Active addresses sustained >150k weekly for 8–12 weeks.
- On-chain transfer volume is rising with a stable median transfer size. Not just whale bursts.
- DEX+CEX depth at 1% price impact above $10m combined. Reduces slippage and panic exits.
- The holder distribution is improving. Top-100 share trending down toward 12–14%.
- Recurring sinks: protocol fees burned per month and the percentage of supply affected.
- Dev traction: commits, new contracts deployed, third-party integrations per quarter.
Plausible growth paths
- Payments niche: meme-native tipping across social apps with auto-convert at checkout. Needs SDKs and low-friction wallets.
- Gaming loop: PEPE as in-game currency with craft sinks, tournament fees, and seasonal burns.
- Brand fandom: limited drops that require time-locked PEPE or staking for access.
- L2 migration for scale: cheaper transfers to support micro-use cases. Must avoid fragmenting liquidity.
What likely won’t move the needle
- One-off burns with no fee engine.
- New listings without deeper order books.
- Roadmaps without shipped contracts and usage.
Long-term potential exists only if PEPE adds real sinks and recurring demand. Without that, price will continue to track liquidity cycles and social buzz.

Pepe Price Predictions 2026-2030: Yearly Tables
| Year | Minimum Price | Average Price | Maximum Price | Implied Market Cap at Max |
|---|---|---|---|---|
| 2026 | $0.00002383 | $0.00002782 | $0.00003858 | $16.23 B |
| 2027 | $0.00004067 | $0.00006180 | $0.00009553 | $40.19 B |
| 2028 | $0.00003282 | $0.00003949 | $0.00005224 | $21.98 B |
| 2029 | $0.00003391 | $0.00004221 | $0.00005052 | $21.25 B |
| 2030 | $0.00004827 | $0.00007917 | $0.00014830 | $62.39 B |
Forecasts: CoinCodex, retrieved April 13, 2026. Not financial advice; models can be wrong and may change.